 |
Langley Research CenterTurbulence Modeling Resource |
Jump to: SA Results, SSTm Results, SSG/LRR-RSM-w2012 Results, Wilcox2006-klim-m Results, K-kL-MEAH2015m Results, EASMko2003-S Results
Return to: Mixing Layer Validation Intro Page
Return to: Turbulence Modeling Resource Home Page
2D Mixing Layer Validation Case
SST-Vm Model Results
Link to SST-Vm equations
Previously on this page the results were reported as SST-V solutions, but more properly they should be referred
to as SST-Vm. Essentially no difference is expected.
Note that thorough
grid studies were not performed for validation cases such as this one.
Some effort was made to ensure reasonable grid resolutions, but there may still be
small noticeable discretization errors. Therefore, these validation results shown should be considered
representative, but not "truth."
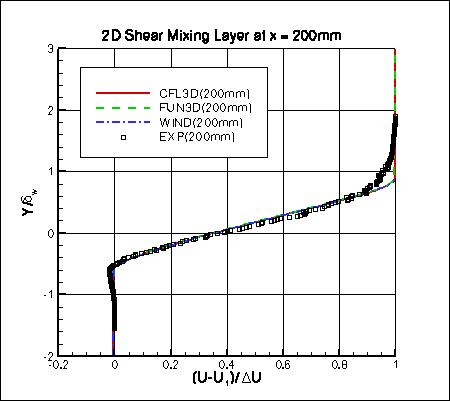
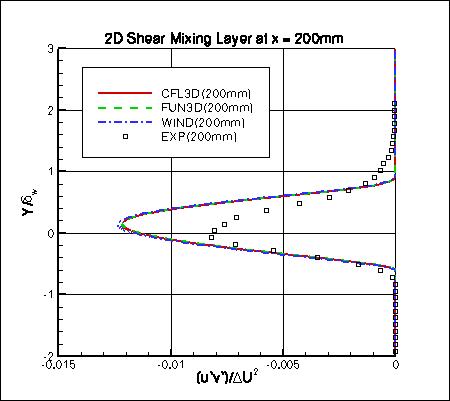
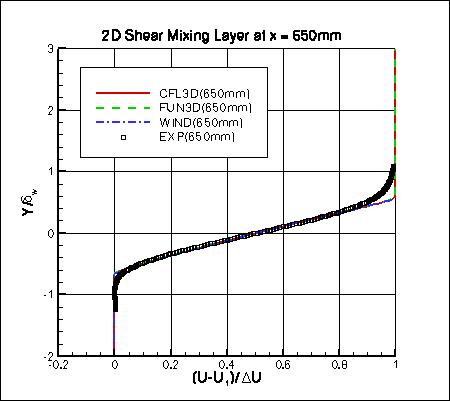
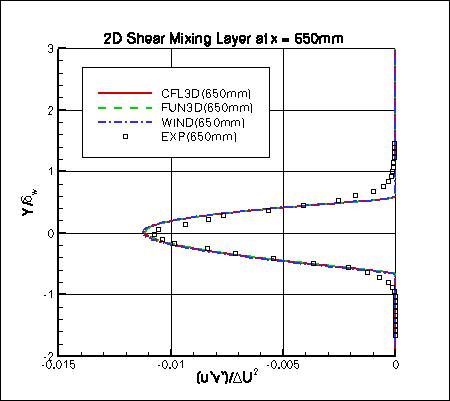
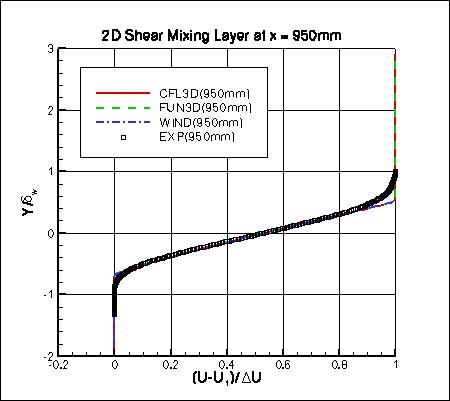
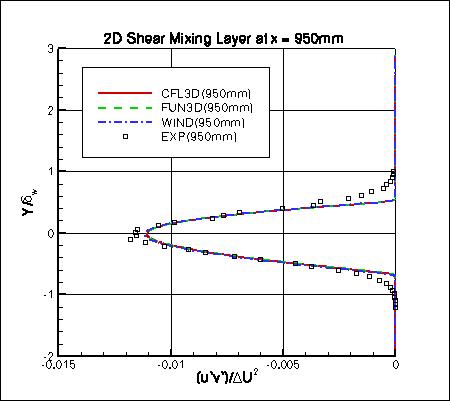
The plots shown compare the SST-Vm results from three independent
CFD codes: CFL3D, FUN3D, and WIND, with the
experimental data at three x-locations of 200mm, 650mm, and 950mm.
Both CFL3D and FUN3D used freestream turbulence intensity=0.064% and freestream turbulent viscosity (relative to laminar)=0.009
(additional details can be found in the CFL3D User's Manual, Appendix H).
WIND used freestream turbulence intensity=0.152% and freestream turbulent viscosity (relative to laminar)=0.001.
Please read note 5 on Notes on running CFD page.
These results are from the second-finest grid (369x369, 89x161, 121x161). Results on the finest grid look the
same to plotting accuracy. The y value is
normalized by the vorticity thickness (from experiment),
the U velocity is normalized by the lower-stream U velocity as well as the change in the
U velocity between lower and upper streams. The specific turbulent shear stress is normalized by
the square of the change in U velocity. Note that use of SST, SSTm, SST-V, or SST-Vm yield nearly identical results for this case.
Note that these are compressible code results at "essentially incompressible" conditions of M=0.121108.
There may be a very small influence of compressibility.
The data files from CFL3D are given here:
mixinglayer_cfl3d_u_sstv.dat,
mixinglayer_cfl3d_uv_sstv.dat.
(Note: some of the profiles have been interpolated using Tecplot software onto pre-set points, that may or may
not correspond to the actual grid points or grid cells used in the computation.)
A typical CFL3D input file is:
delville_cfl3d_typical_sstv.inp.
A typical FUN3D input file is:
fun3d.nml_typical_sstv_2.
Jump to: SA Results,
SSTm Results,
SSG/LRR-RSM-w2012 Results,
Wilcox2006-klim-m Results,
K-kL-MEAH2015m Results,
EASMko2003-S Results Return to: Mixing Layer Validation Intro Page Return to: Turbulence Modeling Resource Home Page
Recent significant updates: Responsible NASA Official:
Ethan Vogel
08/28/2020 - changed SST-V naming to SST-Vm
Page Curator:
Clark Pederson
Last Updated: 02/27/2025