 |
Langley Research CenterTurbulence Modeling Resource |
Return to: Numerical Analysis of 2D Finite Flat Plate Validation Case Intro Page
Return to: Turbulence Modeling Resource Home Page
TURBULENCE MODEL NUMERICAL ANALYSIS
Grids - 2D Finite Flat Plate
Note that the grids and definition of this case have been changed as of 10/02/2014.
The methodology to create
a series of nested grids is provided.
The coordinate system is defined with x streamwise, y spanwise, and z normal.
Each grid is a PLOT3D unformatted file of size ni x nj x nk, where ni
is
the number of points in the spanwise direction (ni=2), nj
is the number of points in the streamwise direction, and nk is
the number of points in the vertical direction.
Each coarser grid is exactly every-other-point
of the next finer grid, ranging from 2 x 2561 x 769 (finest grid) to 2 x 21
x 7 (coarsest grid).
The grids are built in nondimensional units, with the plate extending
from x=0 to x=2 and the grid extending to x=-2 upstream and
x=4 downstream.
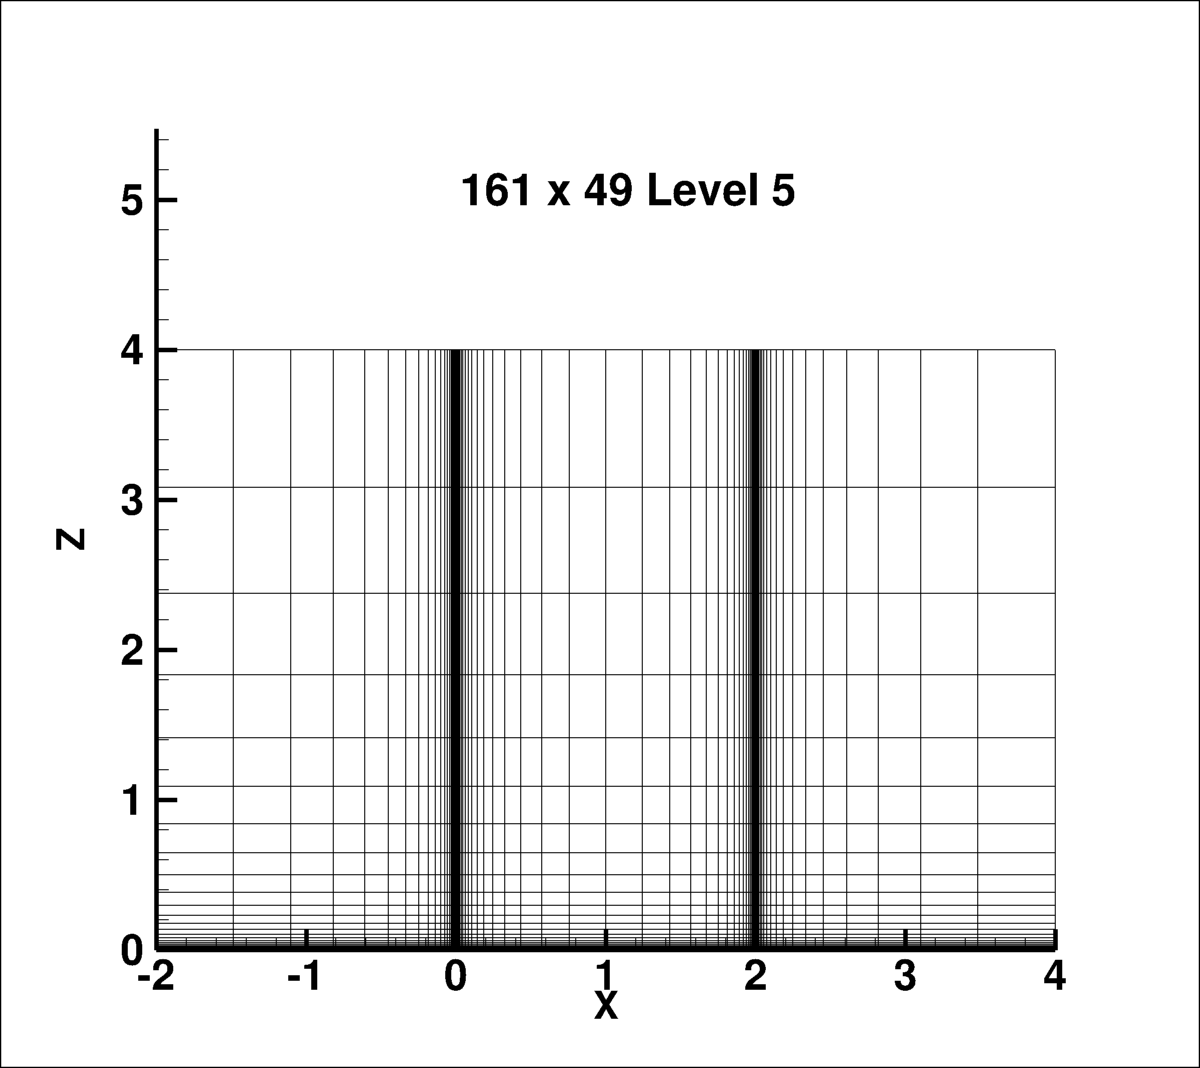
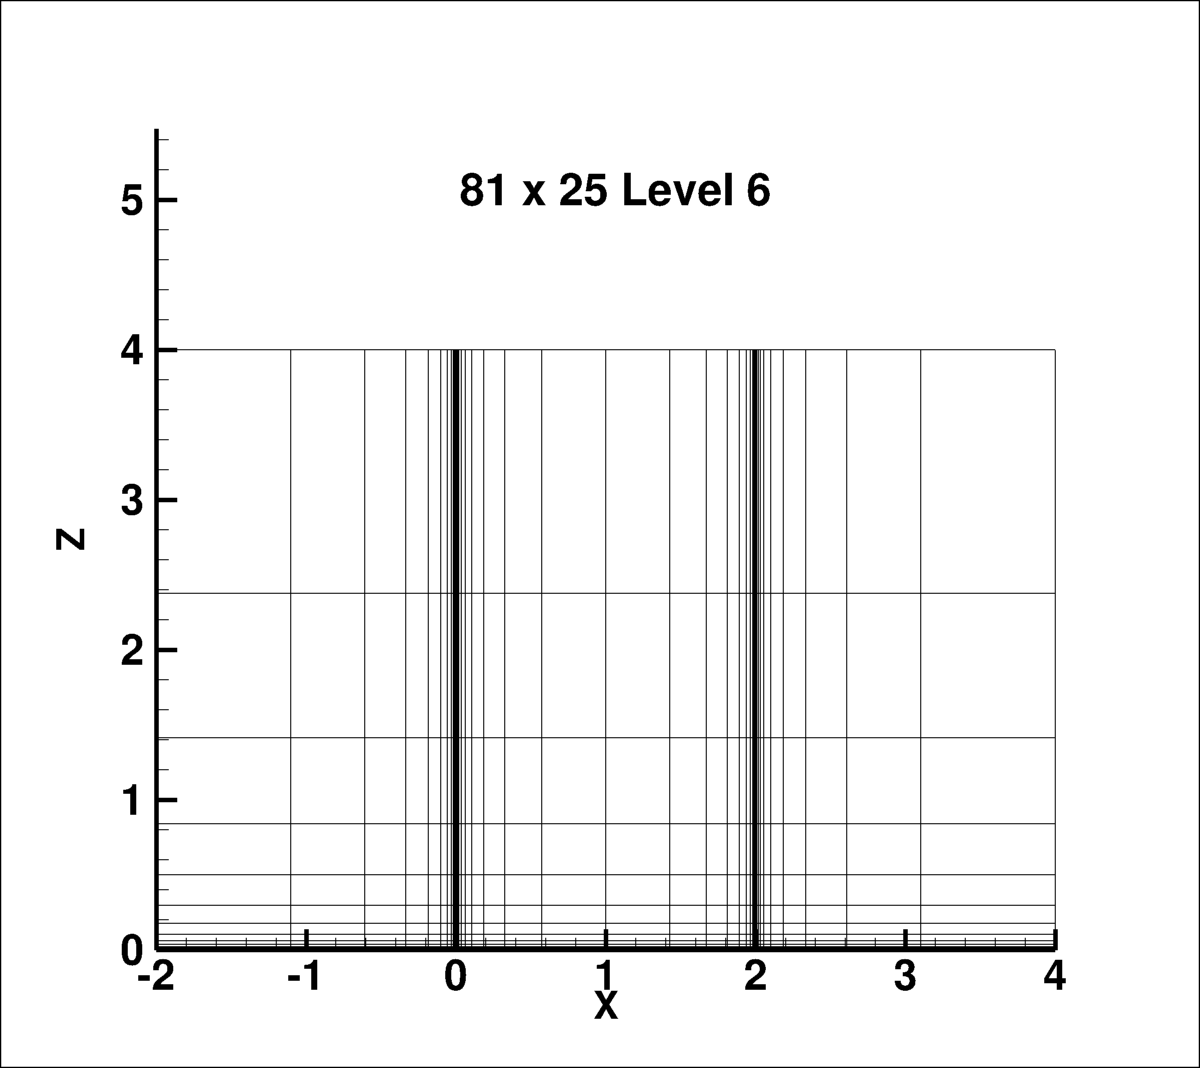
The grid is stretched in the wall-normal directions and is clustered in
the leading and trailing edge regions, with aspect ratio near these areas of approximately 1.
The figure below shows a view of the level 5 grid of size nj=161 x nk=49 in
the streamwise x normal directions.
Note: be sure to use double precision when reading (or writing) the grids!
STRUCTURED VERSIONS OF GRIDS
PLOT3D Files
A simple FORTRAN program (updated on 10/02/2014)
is provided that can be used to generate the grids in PLOT3D format.
All information has been hardwired
into the program except a single integer (between 1 and 8) indicating the level of the
grid to be generated (finest to coarsest).
For example, the cell aspect ratio near the leading
and trailing edges is hardwired via parameter aspect_ratio_edge to be approximately 1.
Neutral Map Files
associated with each grid are also generated by the above program (these files specify grid indices associated
with each boundary condition - see
The Neutral Map File). The following is
an example neutral map file:
Return to: Numerical Analysis of 2D Finite Flat Plate Validation Case Intro Page Return to: Turbulence Modeling Resource Home Page
Responsible NASA Official:
Ethan Vogel
The figure below shows a view of the level 6 grid of size nj=81 x nk=25 in
the streamwise x normal directions.


Page Curator:
Clark Pederson
Last Updated: 11/10/2021