This case is different from
many others on the TMR website, in that only unstructured grids are provided. It was attempted to
create a "family" of grids, but this can be difficult for unstructured grids (see discussion about the importance of grid families in
Notes on Running the Cases with CFD - Note 10).
Results shown here used the "Family 1" set of unstructured grids.
Results here are from 2 compressible codes,
so that the user may compare their own compressible code results. Multiple grids were
used so the user can see trends with grid refinement. Different codes will behave
differently with grid refinement depending on many factors (including code order of accuracy
and other numerics),
but it would be expected that as the grid is refined the results
will tend toward an "infinite grid" solution that is the same.
Be careful when comparing details: any differences in boundary conditions or flow conditions
may affect results.
The RANS codes FUN3D and USM3D were used to compute this
2-D multielement airfoil case with the Spalart-Allmaras turbulence model
with Rotation-Curvature correction
(version SA-neg-RC - see full description on
Spalart-Allmaras page).
Note that SA-neg-RC results are expected to be essentially identical to SA-RC.
The full series of 7 grids were used. FUN3D
is a node-centered unstructured-grid code, and
used Roe's Flux Difference
Splitting and a UMUSCL upwind approach with kappa=0.5 employed.
First-order upwinding for the advective terms of the turbulence model was employed.
Details about the code can be found on its website,
the link for which are given on this site's
home page.
FUN3D was run to near machine-zero iterative convergence, but for this case
it required the use of HANIM (see AIAA-2021-0857,
https://doi.org/10.2514/6.2021-0857).
It should be kept in mind that many of the files given below
contain computed values directly from the code,
using a precision greater than the convergence tolerance (i.e., the values
in the files are not necessarily as precise as the number of digits given).
Details about USM3D are not provided here, but can be found at:
https://tetruss.larc.nasa.gov/usm3d/.
Note that this case should be run "fully turbulent." However, the results
end up being transitional at this Reynolds number,
especially on the flap and on each element's lower surface. For verification
purposes, this should still turn out to be consistent between codes, provided that the same
recommended farfield boundary condition of
 is used.
For the FUN3D and USM3D tests reported below, the turbulent inflow boundary condition used for SA-neg-RC was:
 .
For the interested reader, typical input files for this problem are given here:
FUN3D:
The following plots show the airfoil lift coefficient, drag coefficient, pressure drag coefficient,
viscous drag coefficient, and pitching moment (about x/c=0.25).
In the plot the x-axis is plotting 1/N1/2, which is proportional to
grid spacing (h).
At the left of the plot, h=0 represents an infinitely fine grid.
The FUN3D and USM3D results are very similar.
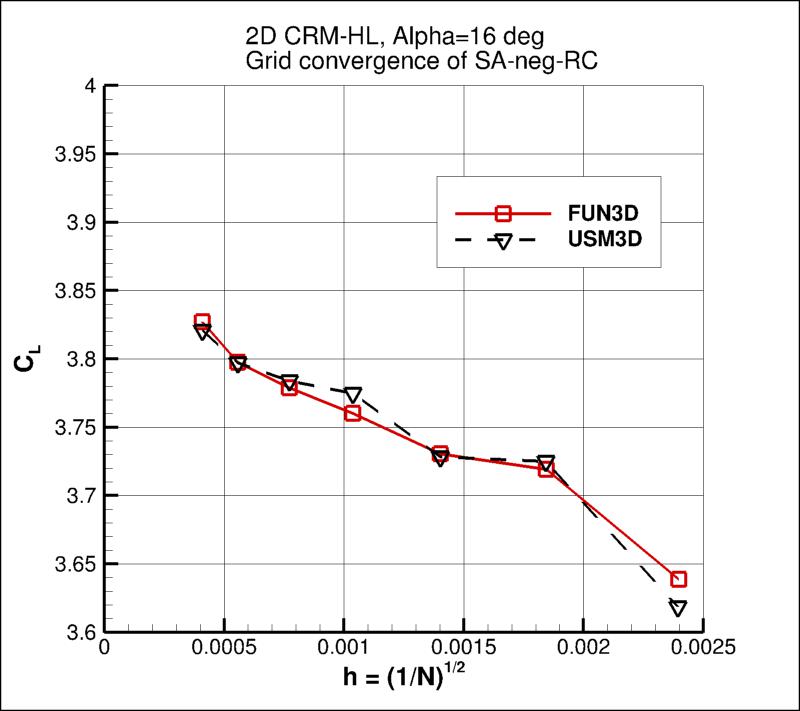
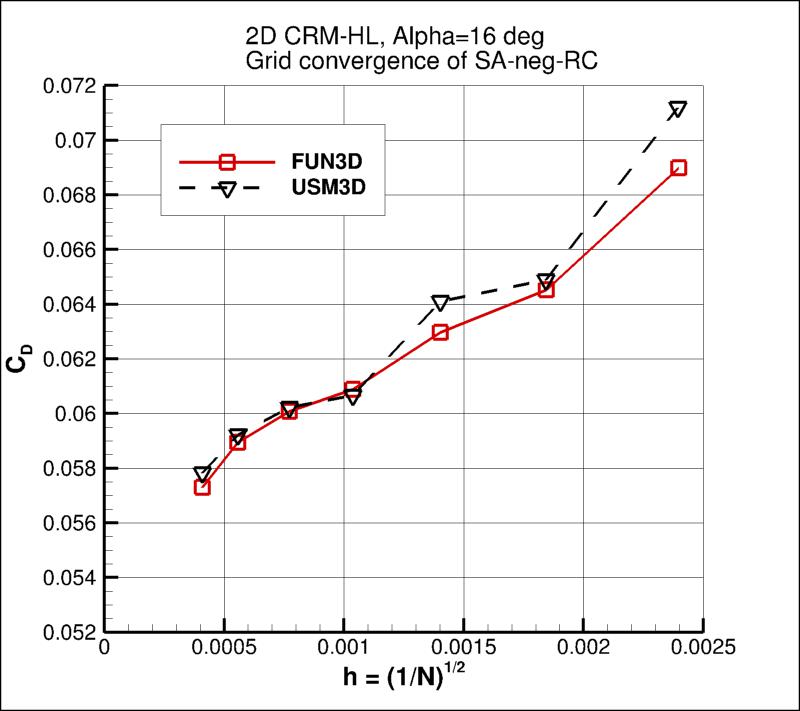
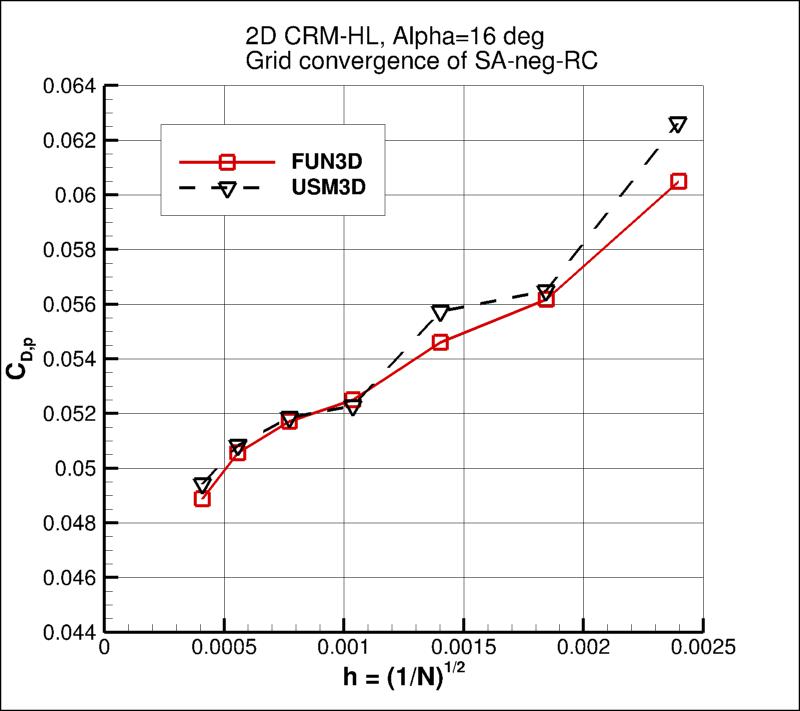
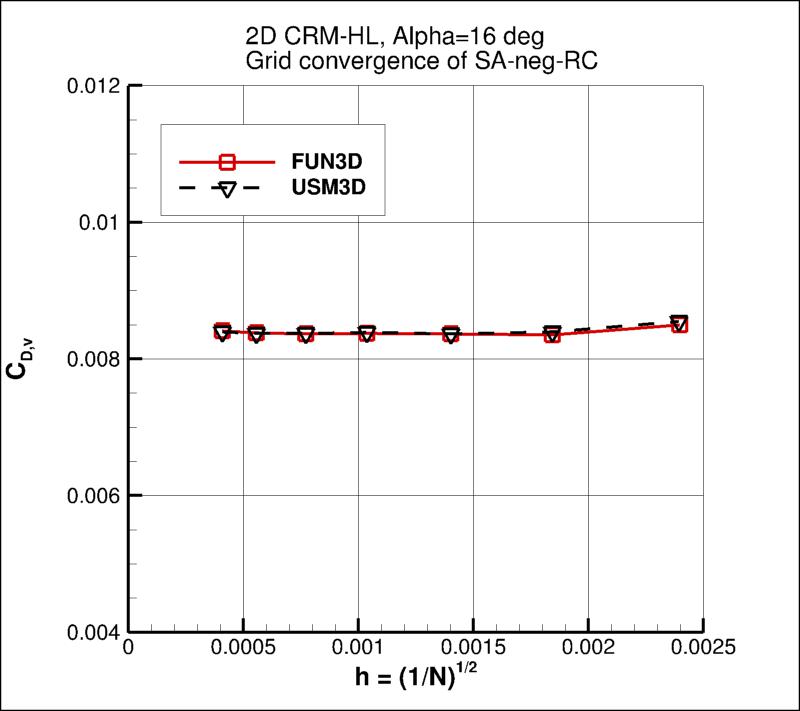
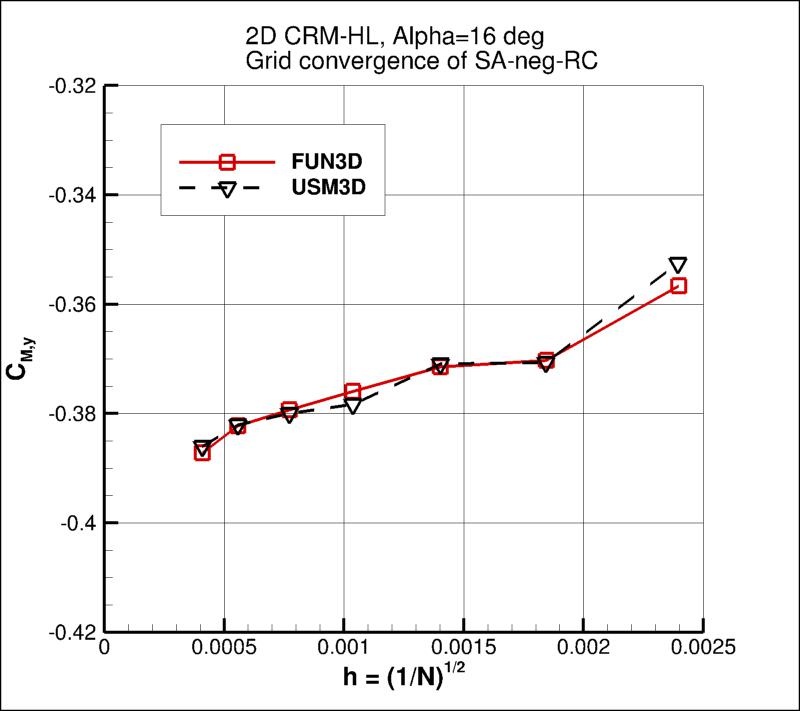
Other than for CDv, it appears that the CFD results are not converging with a reasonable grid-convergence order for this case
(they are not in the asymptotic regime of grid convergence). This is possibly because the grids are not fine enough, but it is
also possible that the transitional behavior of the flowfield (particularly on the upper surface of the flap) is playing a part.
Therefore, we do not provide any uncertainty estimations here.
The data file that generated the above plots is given here:
force_convergence_sanegrc.dat.
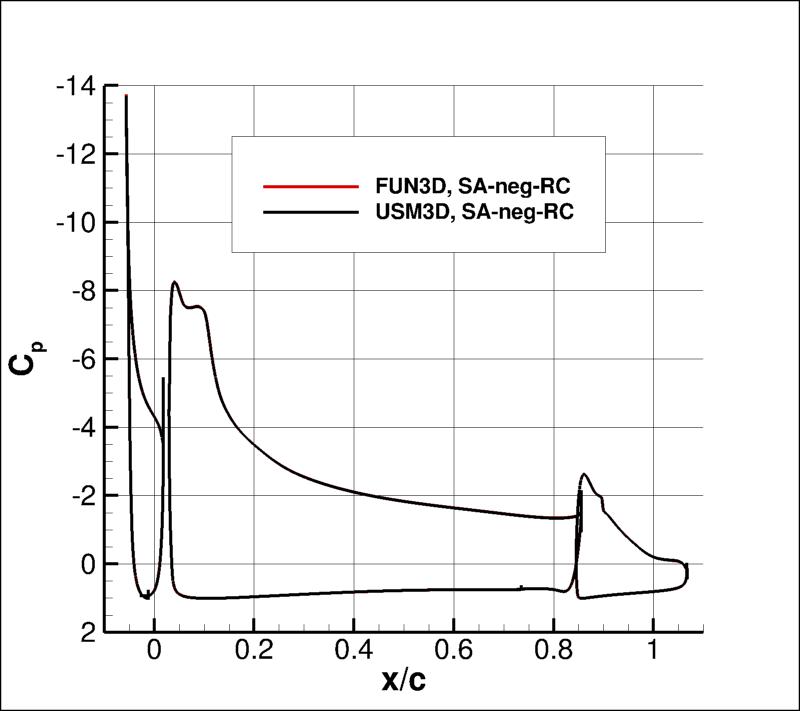
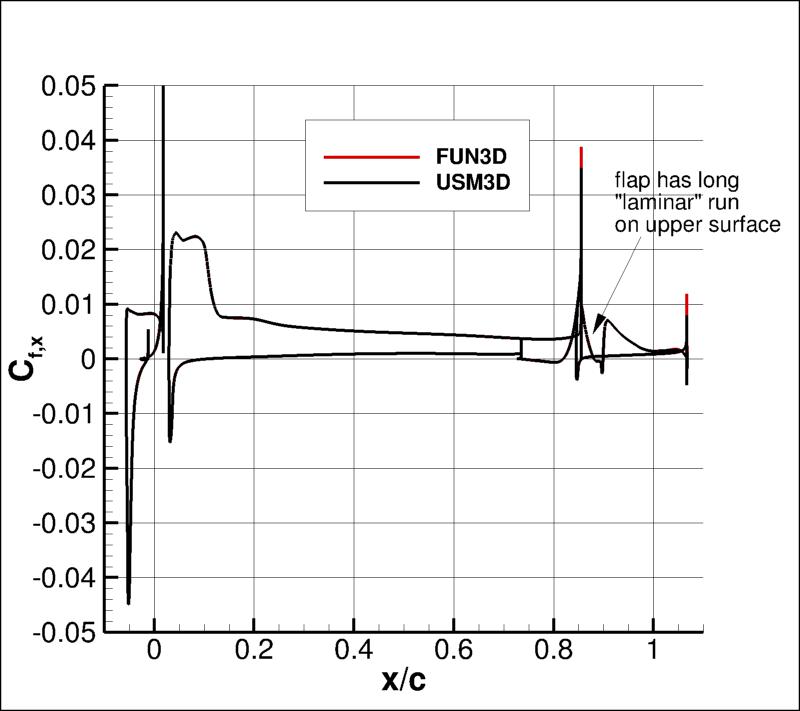
The surface pressure coefficient and x-component of skin friction coefficient
on the finest (L7) grid are shown below.
The results from FUN3D and USM3D agree well with each other.
The data file that generated the above plots is given here:
cp_multielementairfoil_sanegrc.dat and
cfx_multielementairfoil_sanegrc.dat.
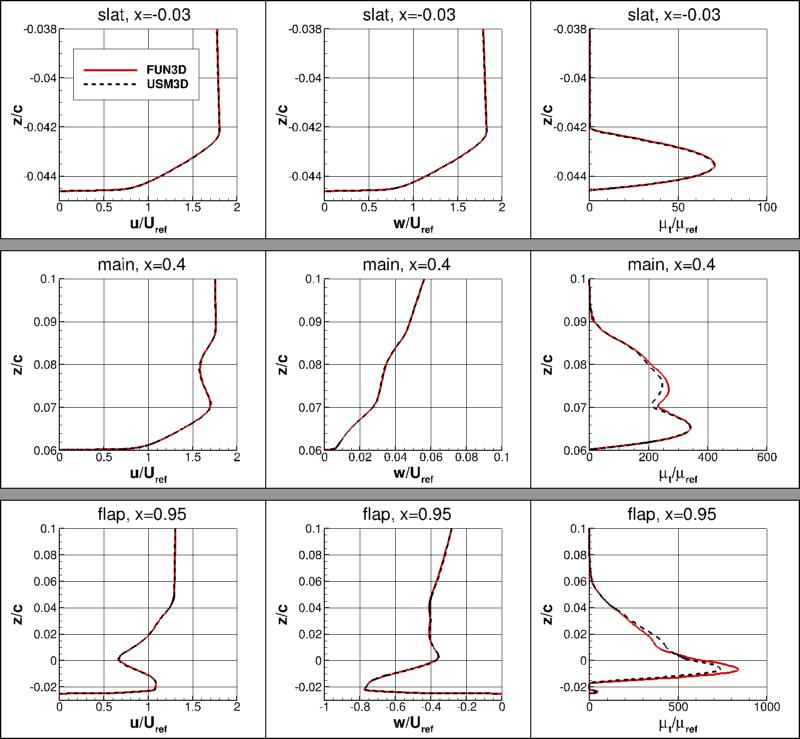
Some profiles over the airfoil upper surface along three specific x-locations are shown below
(on the L7 grid). Results between the two codes are very close.
The data file that generated the above plots is given here:
profiles_3element_sanegrc.dat.
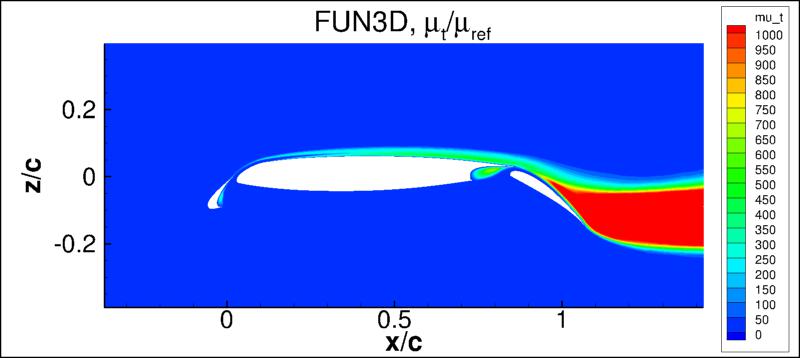
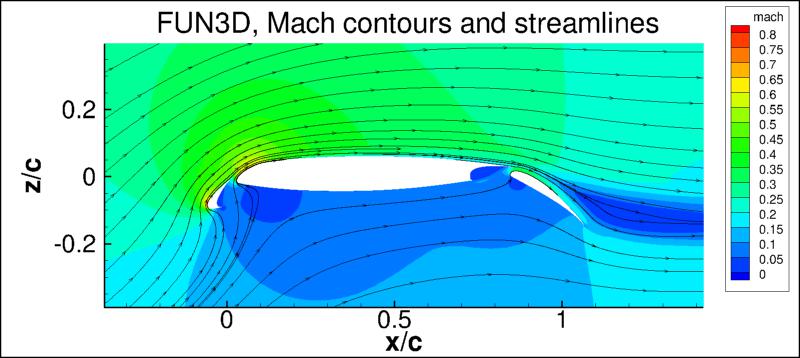
The eddy viscosity contours (nondimensionalized by freestream laminar viscosity)
and Mach contours (along with streamlines computed on the fly in Tecplot)
from FUN3D on the finest grid (L7) are shown
in the following plots.
(Note legends do not necessarily reflect min and max values.)
USM3D results (not shown) are nearly identical.
The data file that generated the above plots are given here:
machmut_contours_fun3d_sanegrc.dat.gz (173.6 MB) (unstructured, at grid points). Note
that this is a gzipped
Tecplot
formatted file, so you must either have Tecplot or know how to read their format in order to use these
files.
The SA-neg-RC model relies on the minimum distance to the nearest wall. For this case,
contours of this function
are shown in the following plot, for the finest grid.
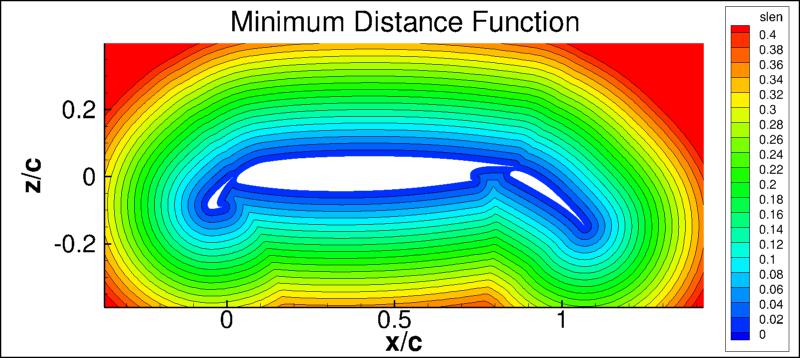
The data file that generated the above plot is given in
multi2d_mindist.dat.gz (gzipped file,
127.8 MB, unstructured, at grid points). Note
that this is a gzipped Tecplot
formatted file, so you must either have Tecplot or know how to read their format in
order to use it.
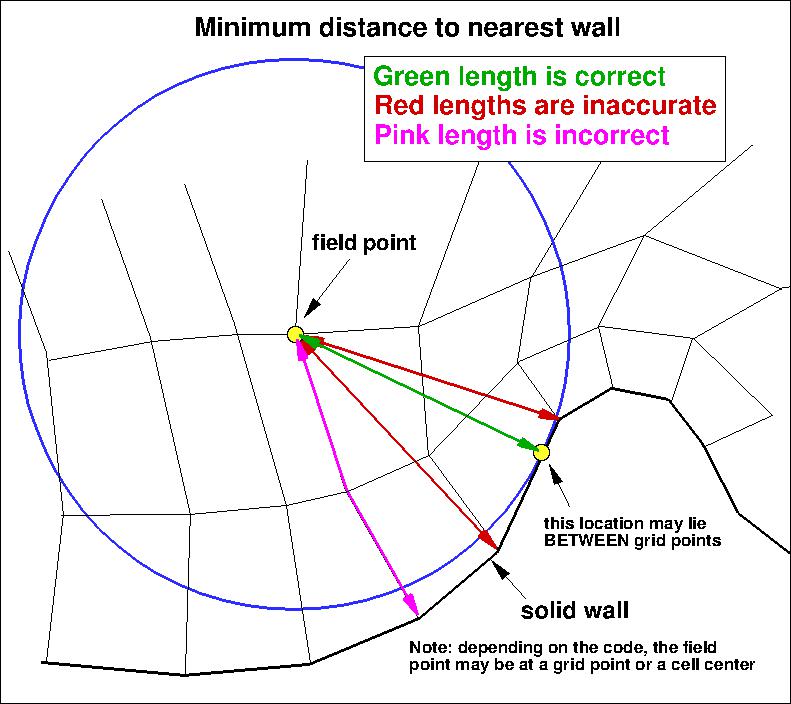
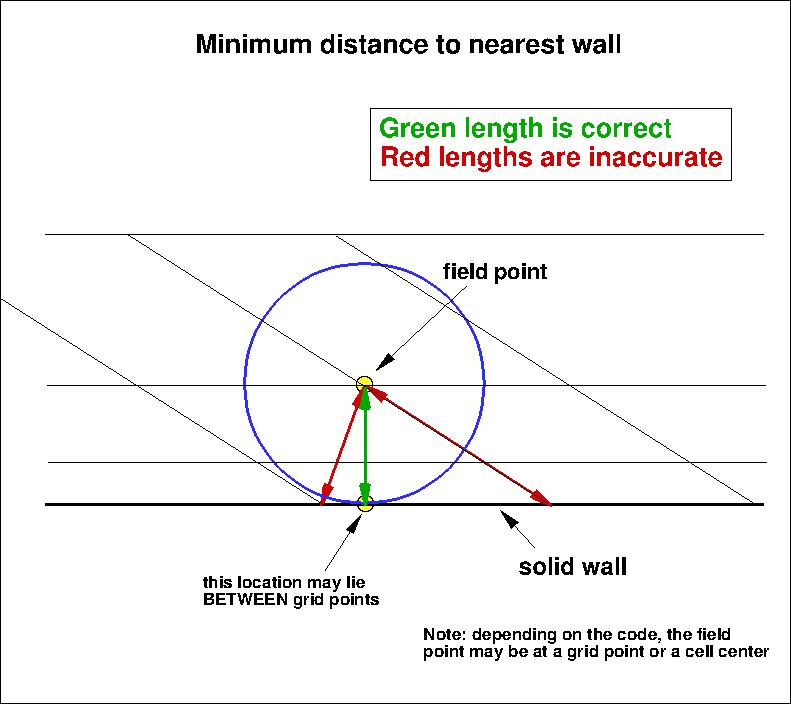
It is important to note that computing minimum distance by searching along grid lines is
incorrect, and is not the same as computing actual minimum distance to the nearest wall for this grid. Using
the former method will yield differences in the results. The following sketches
demonstrate the concept of minimum distance. Improperly-calculated minimum distance
functions will particularly produce incorrect results for cases in which the
grid lines are not perfectly normal to the body surface.
Note that when the nearest wall point is a sharp convex corner or edge (like an airfoil or wing trailing edge) then the
correct minimum distance is the distance to that corner or edge, which is not a wall normal.
Return to: 2D Multielement Airfoil Verification Case Intro Page
Return to: Turbulence Modeling Resource Home Page
Privacy Act Statement
Accessibility Statement
Responsible NASA Official:
Ethan Vogel
Page Curator:
Clark Pederson
Last Updated: 03/01/2023

 This page under construction... Come back later!
 is used.
 .
For the interested reader, typical input files for this problem are given here:


