 |
Langley Research CenterTurbulence Modeling Resource |
Jump to: SA Results, SA-RC Results, SSTm Results, Wilcox2006-klim-m Results, EASMko2003-S Results, K-e-Rt Results, GLVY-RSM-2012 Results
Return to: 2D NACA 4412 Airfoil Trailing Edge Separation Case Intro Page
Return to: Turbulence Modeling Resource Home Page2D NACA 4412 Airfoil Trailing Edge Separation Validation Case
BSLm Model Results
Link to BSLm equations
Previously on this page the results were reported as BSL solutions, but more properly they should be referred
to as BSLm. Essentially no difference is expected.
Note that thorough
grid studies were not performed for validation cases such as this one.
Some effort was made to ensure reasonable grid resolutions, but there may still be
small noticeable discretization errors. Therefore, these validation results shown should be considered
representative, but not "truth."
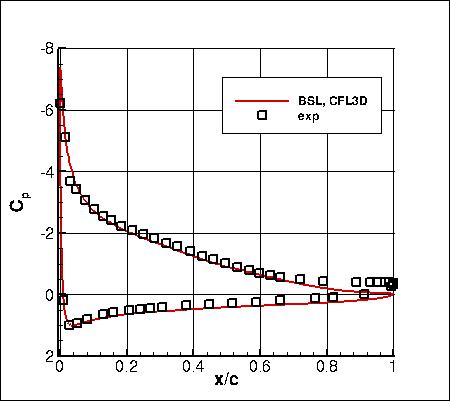
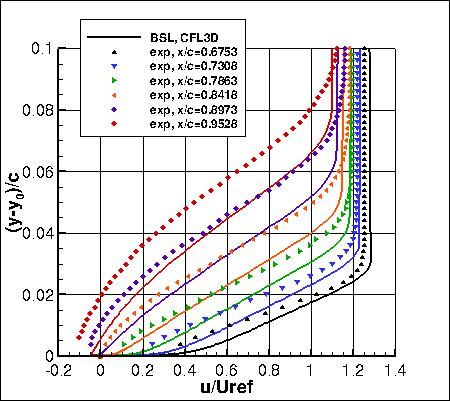
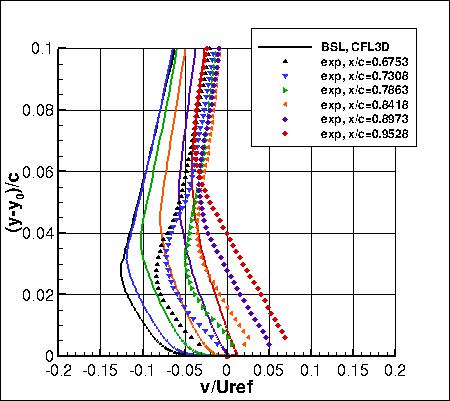
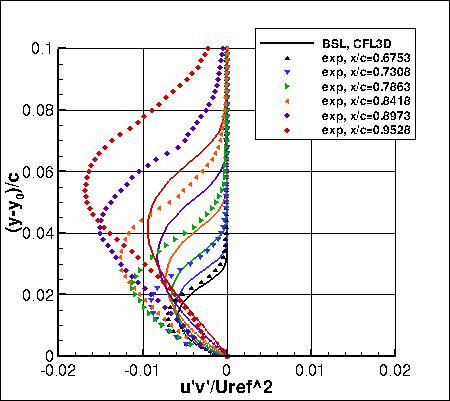
BSLm results from
CFL3D are shown from the second-finest grid (897x257).
Uref in the plots has been scaled as described on the
2D NACA 4412 Airfoil Trailing Edge Separation Case Intro Page.
CFL3D used freestream turbulence intensity=0.086% and freestream turbulent viscosity (relative to laminar)=0.009
(additional details can be found in the CFL3D User's Manual, Appendix H).
Please read note 5 on Notes on running CFD page.
On this grid level, standard lift and drag coefficients based on the freestream conditions listed on the Intro
Page were:
It is important to note that the experimental u, v, and u'v' data were nondimensionalized with respect to
a non-traditional velocity at a location only about 1 chord below and behind the airfoil. This is different from a
traditional "freestream" value. As a result, u/Uinf and v/Uinf values from CFD
need to be divided by roughly 0.93 in order to be
comparable to the experimental normalization u/Uref (where Uinf is the usual farfield freestream value
and Uref is the experimental reference location). Similarly, u'v'/(Uinf2) turbulence values from CFD need to be
divided by approximately 0.932. However, the surface pressure coefficients from CFD agree better with
the experiment on the airfoil lower surface when no such correction is made (the matching of the lower surface
Cp is often used as a way to determine whether or not the flow conditions are consistent). The reason for
this inconsistency is not known. Therefore, all comparisons for this case should only be viewed in a
qualitative sense. Neither the surface pressure coefficients nor the surface skin friction coefficients
from the CFD have been adjusted.
Note that this model is currently assigned
MRR Level 2 for the purposes of this website.
This is because at this time the TMBWG has results for this model
from two different codes from the same home organization.
The results on this page are therefore not necessarily
reliable until additional independent code(s) can be used to verify the model implementation.
Jump to: SA Results,
SA-RC Results,
SSTm Results,
Wilcox2006-klim-m Results,
EASMko2003-S Results,
K-e-Rt Results,
GLVY-RSM-2012 Results Return to: 2D NACA 4412 Airfoil Trailing Edge Separation Case Intro Page Return to: Turbulence Modeling Resource Home Page
Recent significant updates: Responsible NASA Official:
Ethan Vogel
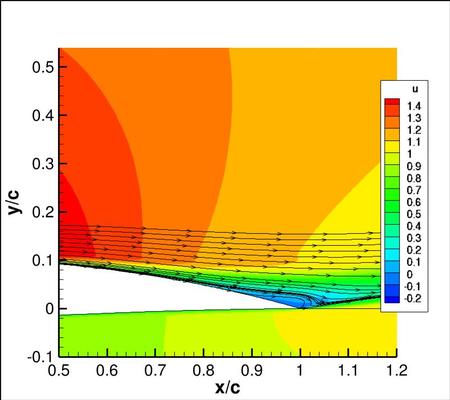
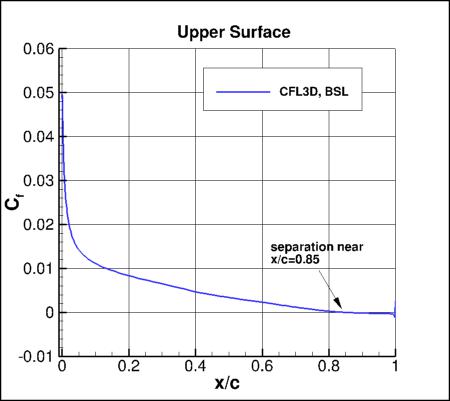
Furthermore,
CFD surface pressure and skin friction coefficients shown in the plots above were based on the freestream conditions.
Note that these are compressible code results at "essentially incompressible" conditions of M=0.09.
There may be a very small influence of compressibility.
The data files from CFL3D are given here:
n4412_cfl3d_cp_bsl.dat,
n4412_cfl3d_vel_bsl.dat,
n4412_cfl3d_uv_bsl.dat,
n4412_cfl3d_cfupper_bsl.dat.
(Note: the profiles have been interpolated using Tecplot software onto pre-set points, that may or may
not correspond to the actual grid points or grid cells used in the computation.)
A typical CFL3D input file is:
n4412_cfl3d_typical_bsl.inp.
12/17/2018 - added link to SA-RC results page
07/28/2016 - added plot of upper surface Cf as well as CDp and CDv values
03/27/2015 - updated plots to reflect proper y-offest in exp data
Page Curator:
Clark Pederson
Last Updated: 03/17/2025