 |
Langley Research Center
Turbulence Modeling Resource
|
Exp: NASA Juncture Flow (JF) - Turbulent
Symmetric Wing Geometry
Return to: Exp: NASA Juncture Flow - Intro Page for Turbulent Symmetric Wing
Return to: Exp: NASA Juncture Flow - Intro Page
Return to: Data from Experiments - Intro Page
Return to: Turbulence Modeling Resource Home Page
CAD FILES FOR THE SYMMETRIC CONFIGURATION (WITH HORN)
The CAD files are the same for the turbulent symmetric wing and transitional symmetric wing.
- As-designed symmetric wing and body with horn/leading edge extension:
-
In_tunnel_symmetric.tar.gz (gzipped tar file, 10.3 MB)
- Contains 14x22 tunnel
definition, as-designed symmetric wing and body with horn/leading edge extension placed
with respect to the tunnel at 3 different angles of incidence (0, 1, and 5 deg), and approximated mast/sting definitions).
- Some important information needed for running Juncture Flow CFD in the tunnel is provided on the
JF Turbulent Symmetric Wing Boundary Conditions page.
Notes:
- Three CAD formats are provided: The Parasolid (x_t) files are the "native" files, with default units of meters. The
STEP (stp) and IGES (igs) file versions are given in mm. Because the experimental data are provided in mm, for direct
comparisons it is recommended that units of mm be used when building CFD grids.
- The experimental data has the fuselage nose at (0,0,0), x axis along the body axis, z up, and y out
the starboard side. Also, all LDV data profiles (as well as all surface pressure taps) are aligned with this
body axis system. When extracting velocities, Reynolds stresses, etc. from CFD, this is the coordinate system
that you need to use when comparing with the experimental data. The "as-designed symmetric wing and body"
CAD definitions are already in this coordinate system.
- Sting and mast models are included in "In_tunnel_symmetric.tar.gz", but these are only crude approximations.
Their positioning relative to the tunnel
was based on GIS laser scans. Also, there were cables that ran along
the bottom of the sting and then down the outside of the mast and along the tunnel floor. The entire sting was wrapped with
tape to secure the cables in place. The shape due to cables/tape is not included in the approximated models.
- None of the files provided above account for any aeroelastic deflection.
- The CAD of the wind tunnel high-speed leg was created from a laser scan, but was simplified (many recesses etc were faired
over or ignored). This simplified as-built model was also used/evaluated in AIAA Paper 2015-2022.
The wind tunnel CAD is positioned with x=0 at the start of the test section, and y=z=0 is along the "centerline" (z=up).
- The wind tunnel's outer wall (sometimes referred to as the "north wall") is located to the left when facing forward (pilot's view);
the inner wall ("south wall") is located to the right.
- The wind tunnel has a 127 mm wide flow-straightening honeycomb centered near x = -20.117 m, followed by 4 screens
near x = -19.291, -19.063, -18.885, and -18.707 m. For this and other 14x22
wind tunnel details, see
NASA TP 3008, September 1990 and
NASA TM 85662, December 1983.
(Note the latter paper title refers to the 14x22 tunnel in metric units: 4- by 7-Meter. However, nowadays
the tunnel is typically referred to by its name referenced in feet.)
- In the wind tunnel, the approximate locations of the probes used to determine running conditions are:
- Total Pressure: (x,y,z) = (-18.105, -7.010, -4.084) m (1.646 m away from the north wall)
- Static Pressure: (x,y,z) = (-3.658, -3.048, 0) m (355.60 mm away from the north wall)
- Stagnation Temperature: (x,y,z) = (-0.140, -3.234, -0.269) m (82.55 mm away from the north wall)
- Dewpoint sensor orifice: (x,y,z) = (-0.140, -3.317, -0.187) m (on the north wall)
- The symmetric wing is a unique blend of NACA 0015 shape near the root, with other (thinner) NACA 0012 and 0010 shapes outboard.
The 0015 is highlighted in its naming because the 0015 shape is at the juncture region of interest. The horn (leading edge
fillet) at the wing root leading edge of course alters the wing shape inboard.
The fuselage used in the Juncture Flow experiment is the same for all tests.
- At the wing-root juncture near the wing trailing edge where separation occurs, the fuselage body is at y=-236.098 mm and the
wing trailing edge is at approximately x=2962.6 mm.
- The approximate rotations/translations (in order) to get the model (with nose at (0,0,0), x axis along the body axis, z up, and y out
the starboard side) into position in the wind tunnel (all units in mm) are:
- Incidence angle = 0 deg:
- X-rotation = 0.002195447 deg
- Z-rotation = -0.000001411 deg
- Y-rotation = 0.0 deg
- X-translation = 2966.275975287
- Y-translation = -6.576907483
- Z-translation = 12.281882905
- Incidence angle = 1 deg:
- X-rotation = -0.014499996 deg
- Z-rotation = 0.0 deg
- Y-rotation = 0.999997901 deg
- X-translation = 2959.491728026
- Y-translation = -5.359448040
- Z-translation = 51.985756977
- Incidence angle = 5 deg:
- X-rotation = 0.055087929 deg
- Z-rotation = 0.000002160 deg
- Y-rotation = 4.999979516 deg
- X-translation = 2920.490901014
- Y-translation = -2.115623105
- Z-translation = 221.338871456
- Data were not taken to determine angle of attack corrections (accounting for influence of the tunnel walls).
Therefore, in free-air CFD runs to date, the nominal incidence angles of 0, 1, and 5 degrees were used for freestream angle of attack.
This is obviously not strictly correct, but arguably the effect on many
quantities of interest (QoI) is relatively minor.
- In the experiment, forces and moments were not measured.
- During the tunnel runs, the goal was to try to keep a reference point on the model (2.448 m behind the model nose tip
and on the fuselage centerline) located approximately 5.4 m from the test section entrance and at the center of the test
section (approx 2.2098 m above the floor). However, at some negative angles, this was
impossible.
Laser scans of the model were taken at angles of 0, 1, and 5 deg, providing information used to make CAD
representations of the actual model positions, provided in the file In_tunnel_symmetric.tar.gz (given above).
However, the laser scans were performed wind off, so the test article position in the CAD files had to be adjusted slightly
to achieve the wind-on angle of incidence. This was done by keeping the mast location as measured, and adjusting the test article and
sting positions. The real sting had some bending (wind on), but in the CAD the sting is represented as straight.
The equations for the height of the model's reference point (x=2448 mm, z=0 mm) above the floor can
be approximately expressed as:
- For -10 ≤ alpha < -2.75, H = 2540.1 + 117.91*alpha (mm)
- For -2.75 ≤ alpha ≤ 10, H = 2209.8 mm
- The roll angle was never intentionally adjusted but did show a roughly
linear relationship with the angle of incidence, ranging from approximately -0.07 deg at pitch angle = 10 deg to 0.07 deg at -10 deg.
- The average roughness and the rms roughness for the painted model surface was 2.70 +- 0.94 μm and 3.33 +- 1.12 μm,
respectively.
DISCUSSION OF MODEL TRIPS
The boundary layers on the symmetric wing
model were tripped using cylindrical trip dots with diameter 1.16 mm and center-to-center spacing
of 2.47 mm. The trip dot effectiveness effectiveness was verified by infrared thermography.
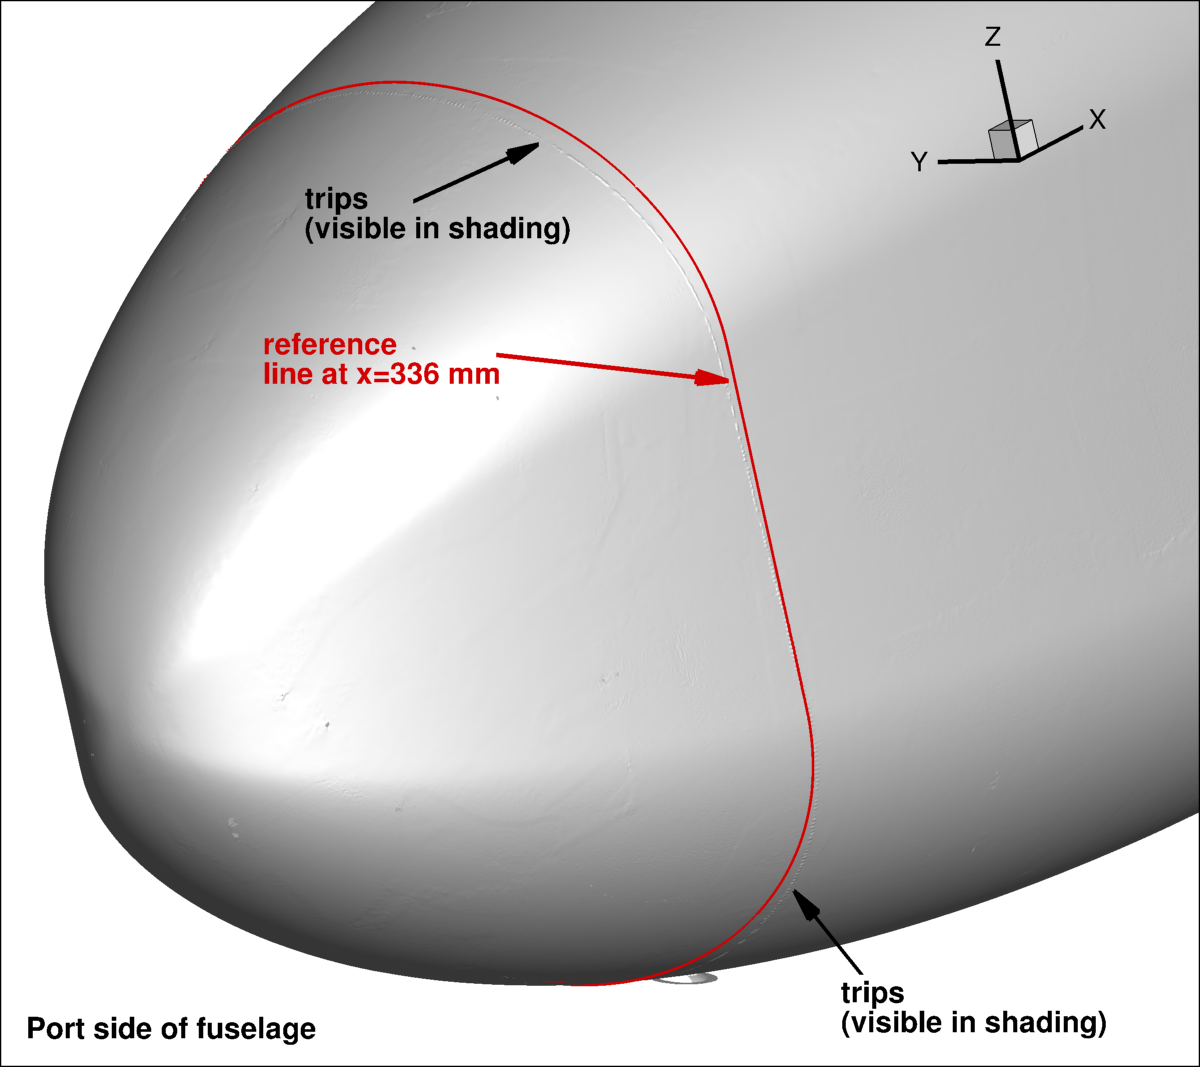
11.4 mil (289.4 micrometer) high trip dots (blue color) were placed on the fuselage at an arc distance of approximately 16 inches
(406 mm)
from the fuselage nose, or at an x location of approximately x=336 mm.
8.6 mil (218.4 micrometer) high trip dots (white color) were placed on the upper and lower surfaces of the
wings at a chordwise position (arc distance along the surface) of 6.4%. These trip dots were applied across
the entire wing span. 8.1 mil (205.7 micrometer) high trip dots (also white color) were also placed on the upper and lower surfaces
of the wings at a chordwise position of 1.6%. However, these trip dots were only applied to the outer
approx 75% of the wing span. This second row of trip dots was needed to eliminate a laminar leading-edge
separation that formed for angles of incidence of 7 degrees and greater. This LE separation was primarily
on the outboard regions of the wing where the airfoil sections are thinner (the 0012 and 0010 sections).
For the trip dots placed by hand around the nose of the fuselage, nominally the goal was to place
them on the side of the fuselage a specific distance from the nose (running along the surface), then to maintain
this x-location all the way around. From the laser scan, the actual x-location varied in the
range 324 < x < 359 mm, approximately as follows:
- On the flat port side: x=329 mm top flat section, increasing to x=339 mm bottom flat section
- On the flat starboard side: x=340 mm top flat section, increasing to x=343 mm bottom flat section
- On the top: x=329 mm left, decreasing to 324 mm near y=-112 mm, then increasing to x=340 mm right
- On the bottom: x=339 mm left, increasing to x=359 mm near y=-8 mm, then decreasing to x=343 mm right
The following figure is from an STL file created from the scanned points of the symmetric wing and
body with horn/leading edge extension (note that the STL file
introduces additional wiggles and non-smoothness that is not present in the real geometry). This scan
result can be used to visualize and verify the trip dot placement.
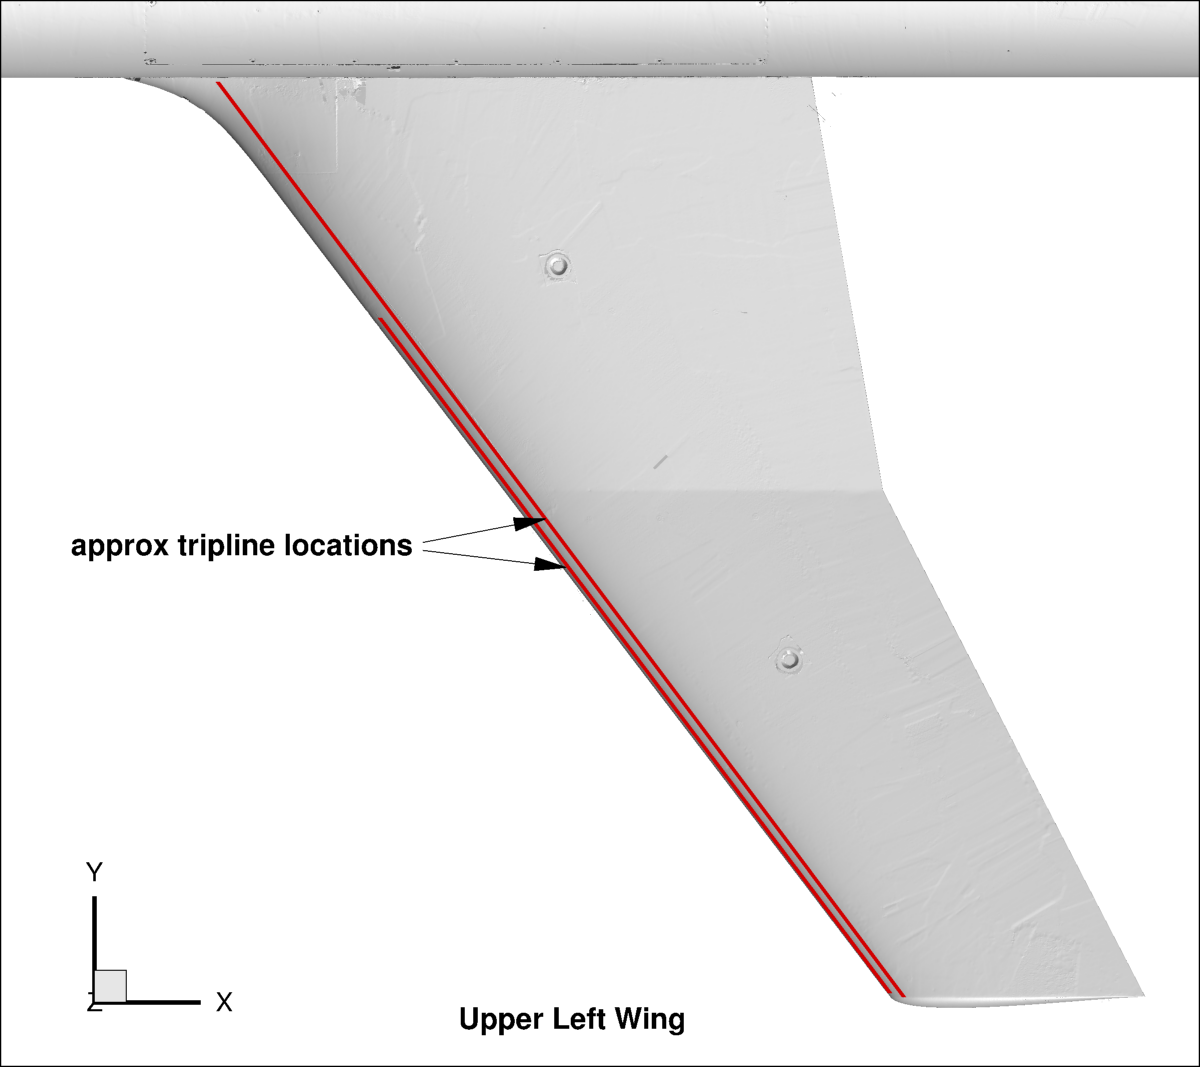
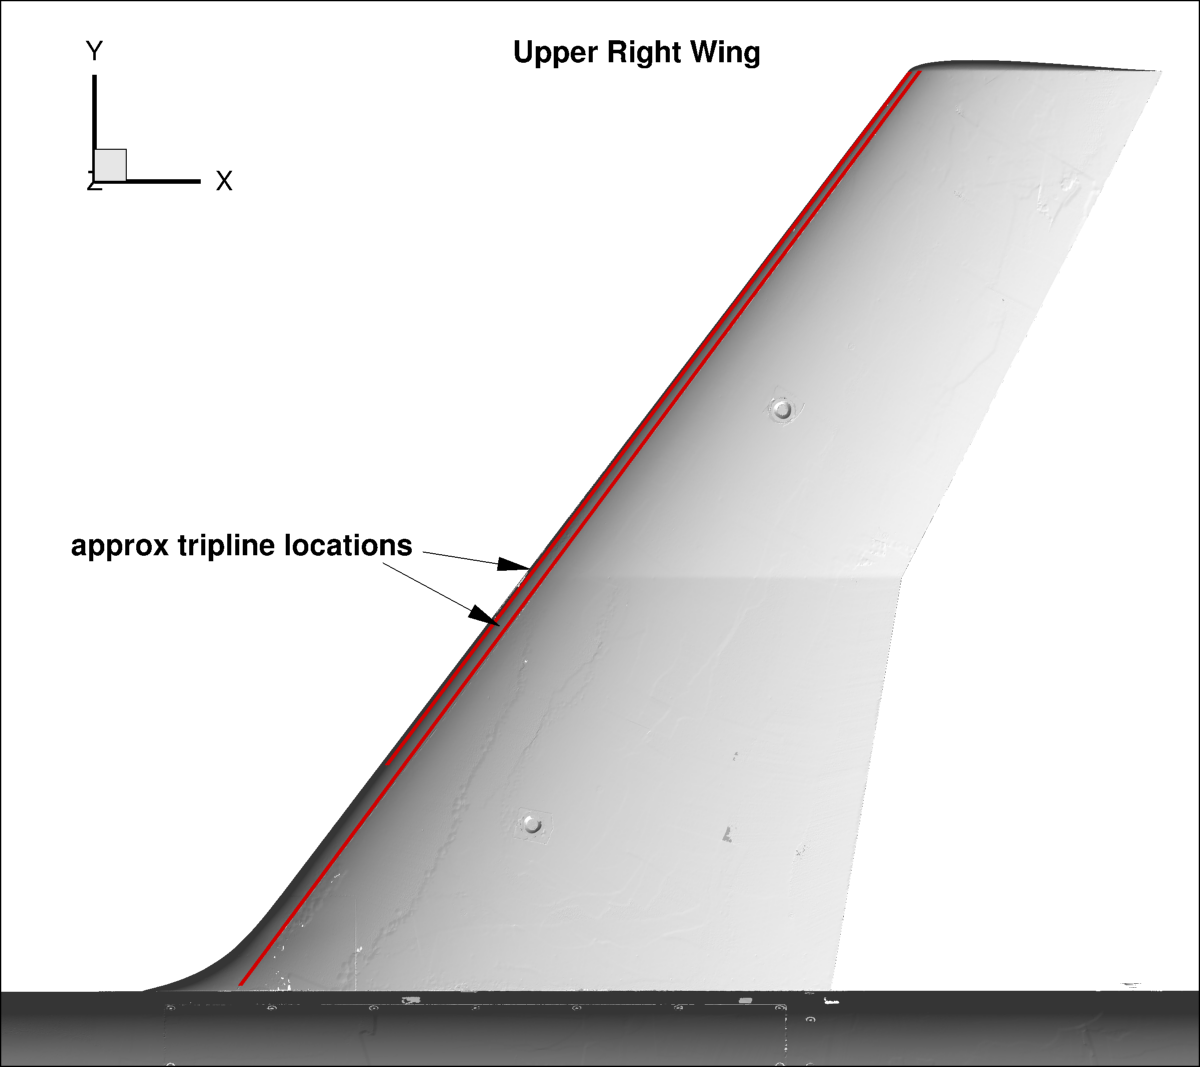
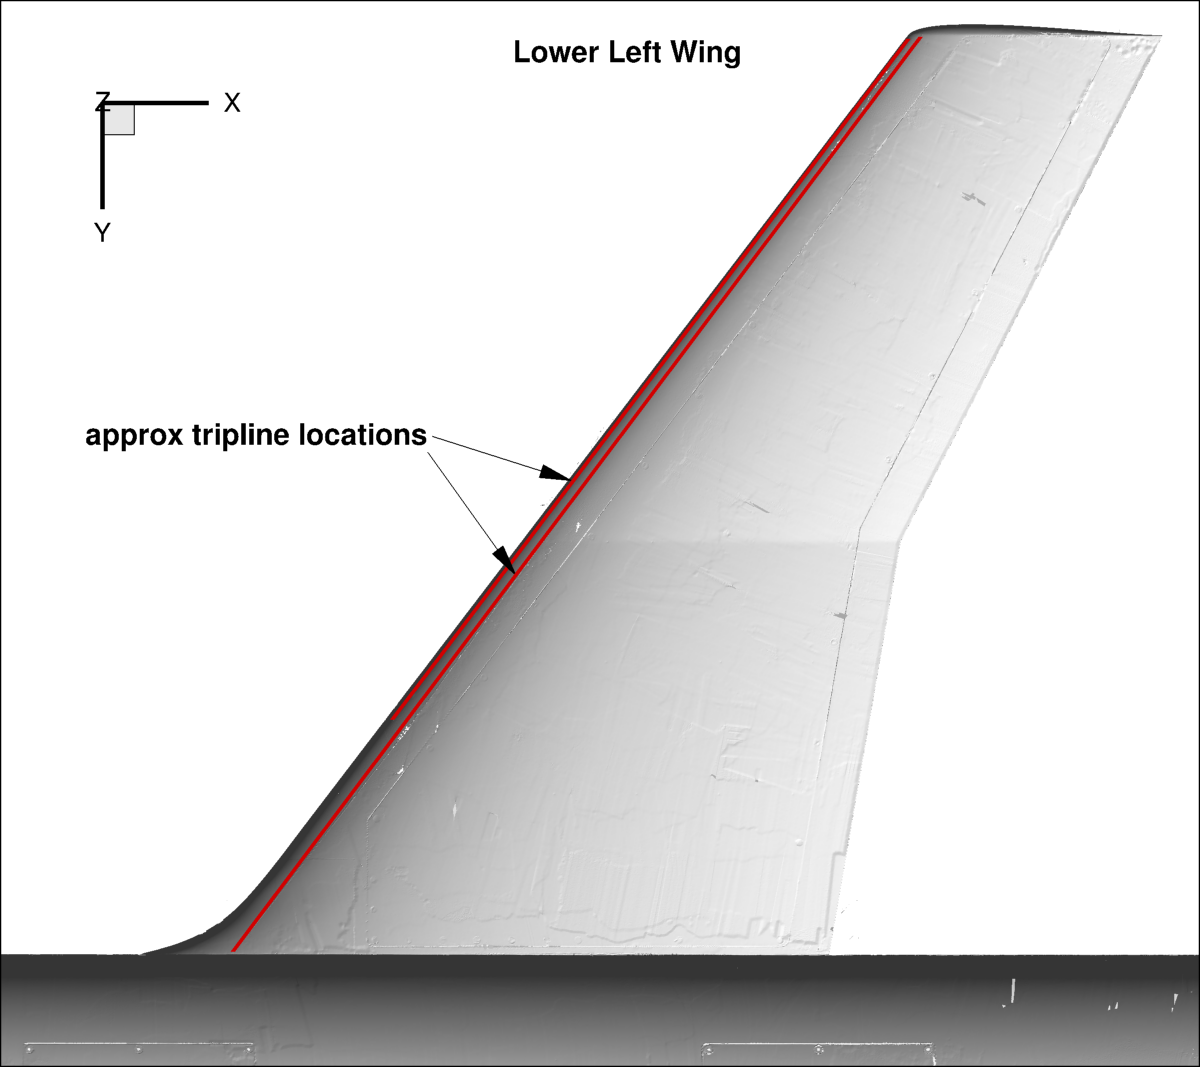
On the wing, trip dots were placed on both upper and lower surfaces by
marking out (1) roughly 6.4% local chord for a line of dots from root to near the tip;
and (2) roughly 1.6% local chord for a line of dots over the outer 75% of the wing (from somewhere near y=580-596 mm to near the tip).
The trip dots were applied by hand in roughly straight lines.
Although the laser scan shows some variations, these trip locations can
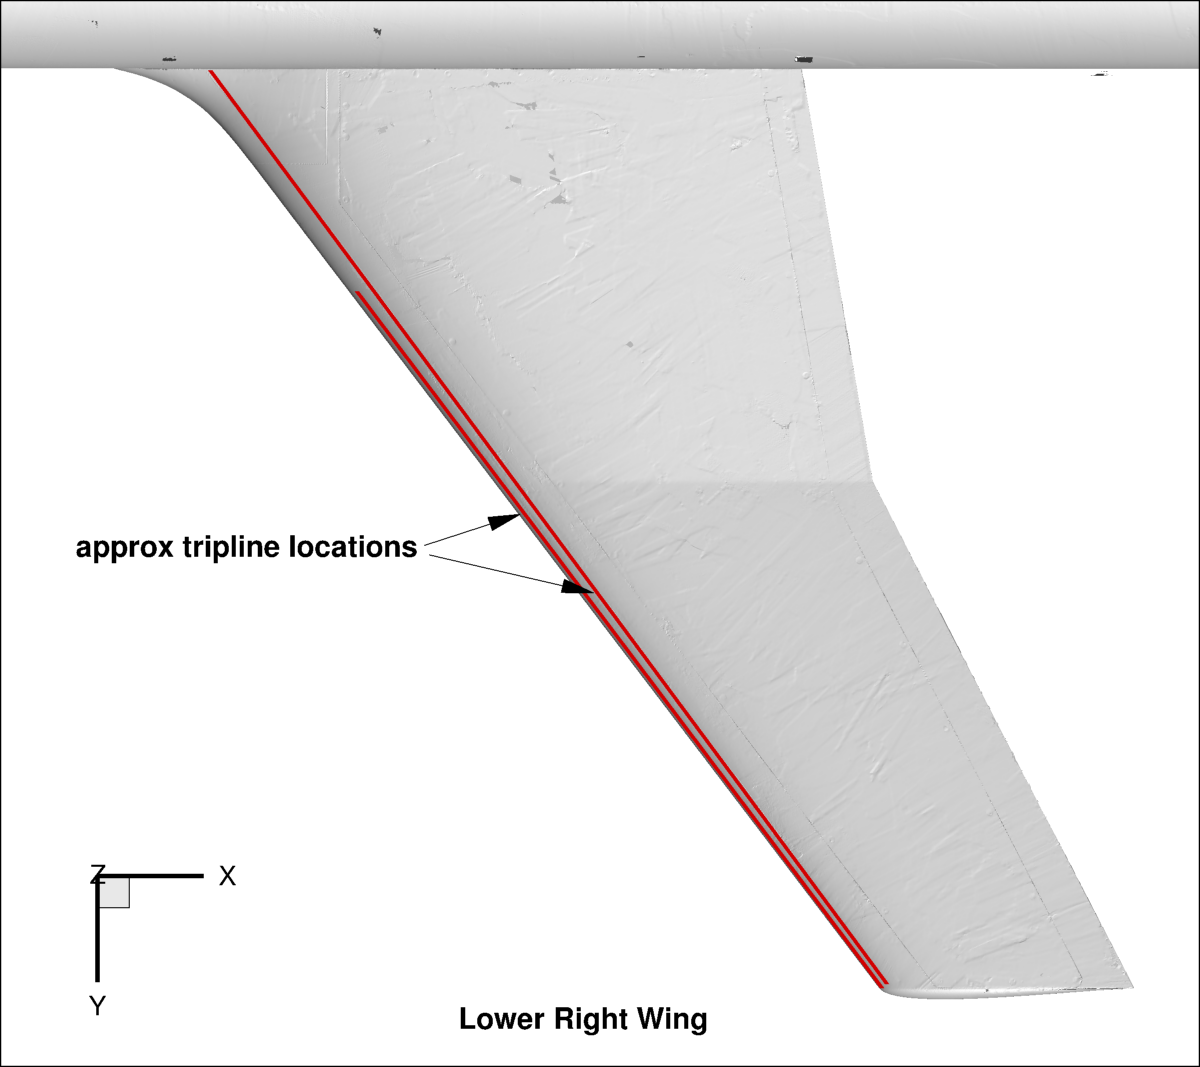
very crudely be approximated by the following lines projected onto the wing surface (in mm):
- Left wing from root to near the tip: x = (2493.763-y)/1.33344
- Right wing from root to near the tip: x = (2493.763+y)/1.33344
- Left wing from approximately y=-596 mm to near the tip: x = (2441.230-y)/1.32374
- Right wing from approximately y=580 mm to near the tip: x = (2441.230+y)/1.32374
The following figures show the approximate wing tripline locations (recall that the STL
version of the scanned points introduces non-physical geometric behavior that appears as
surface wiggles and non-smoothness in these figures).
DISCUSSION OF MODEL DEFORMATION
There are always aeroelastic deflections in any
model. These are not accounted for in any of the files provided above. Details for the symmetric wing are
not available. However, see the
Turbulent F6-Based Geometry page for discussion of photogrammetry
results for the F6-based wing.
DISCUSSION OF AS-BUILT VS. AS-DESIGNED SHAPE OF THE MODEL
The as-designed model shape is provided above.
In addition to aeroelasticity influence, there is also the question of how close the as-built shape was to the as-designed.
The requested model manufacturing tolerance for most parts was 0.005 inches (0.127 mm), but the assembly of the model parts
no doubt adds uncertainty.
A known difference is additional thickness due to paint (the model was painted to reduce flare during LDV data
acquisition). This paint thickness is estimated to be roughly 0.010 - 0.014 inches (0.254 - 0.356 mm).
Detailed laser scanning was done for the symmetric wing and body with horn/leading edge extension
in situ (in the tunnel with wind off) using an API Arm Portable Coordinate
Measuring Machine. To date, analysis of this data has proved to be difficult.
The measurement accuracy of the machine is reported to be
less than about 0.1 mm (about 0.004 inches). However, movement of the laser scan operator around the
model while holding the machine's arm (with the machine's tripod base standing on the wind tunnel floor
near the model) was seen to
yield instantaneous deviations of as much as 4 times this level (about 0.015 inches).
In any case, attempting to create a smooth surface from the points is very difficult and
often results in additional wiggles, steps, and other non-physical features.
Also, the scanning apparently picked up
wing "drooping" due to gravity, which will not match the as-designed shape. The drooped shape is also not appropriate
for a wind-on situation.
One can try to compare the scanned points with the as-built shape, but alignment can be challenging.
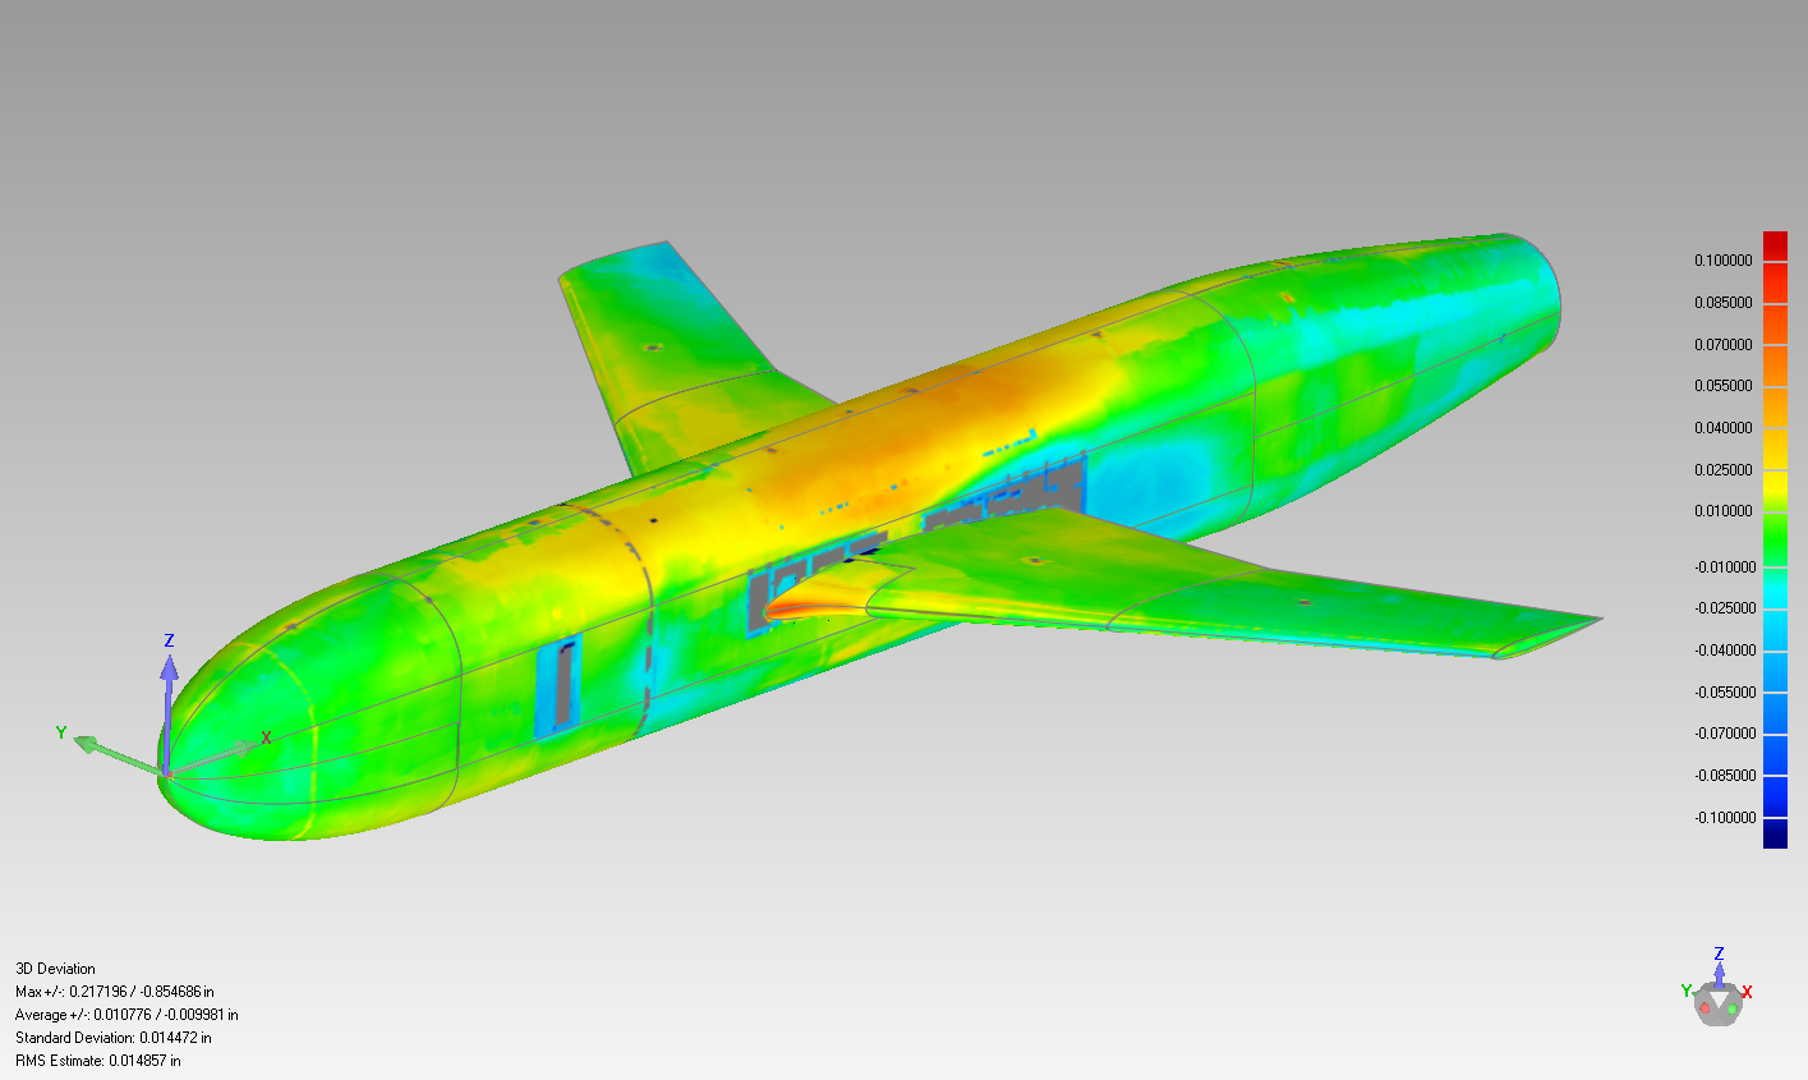
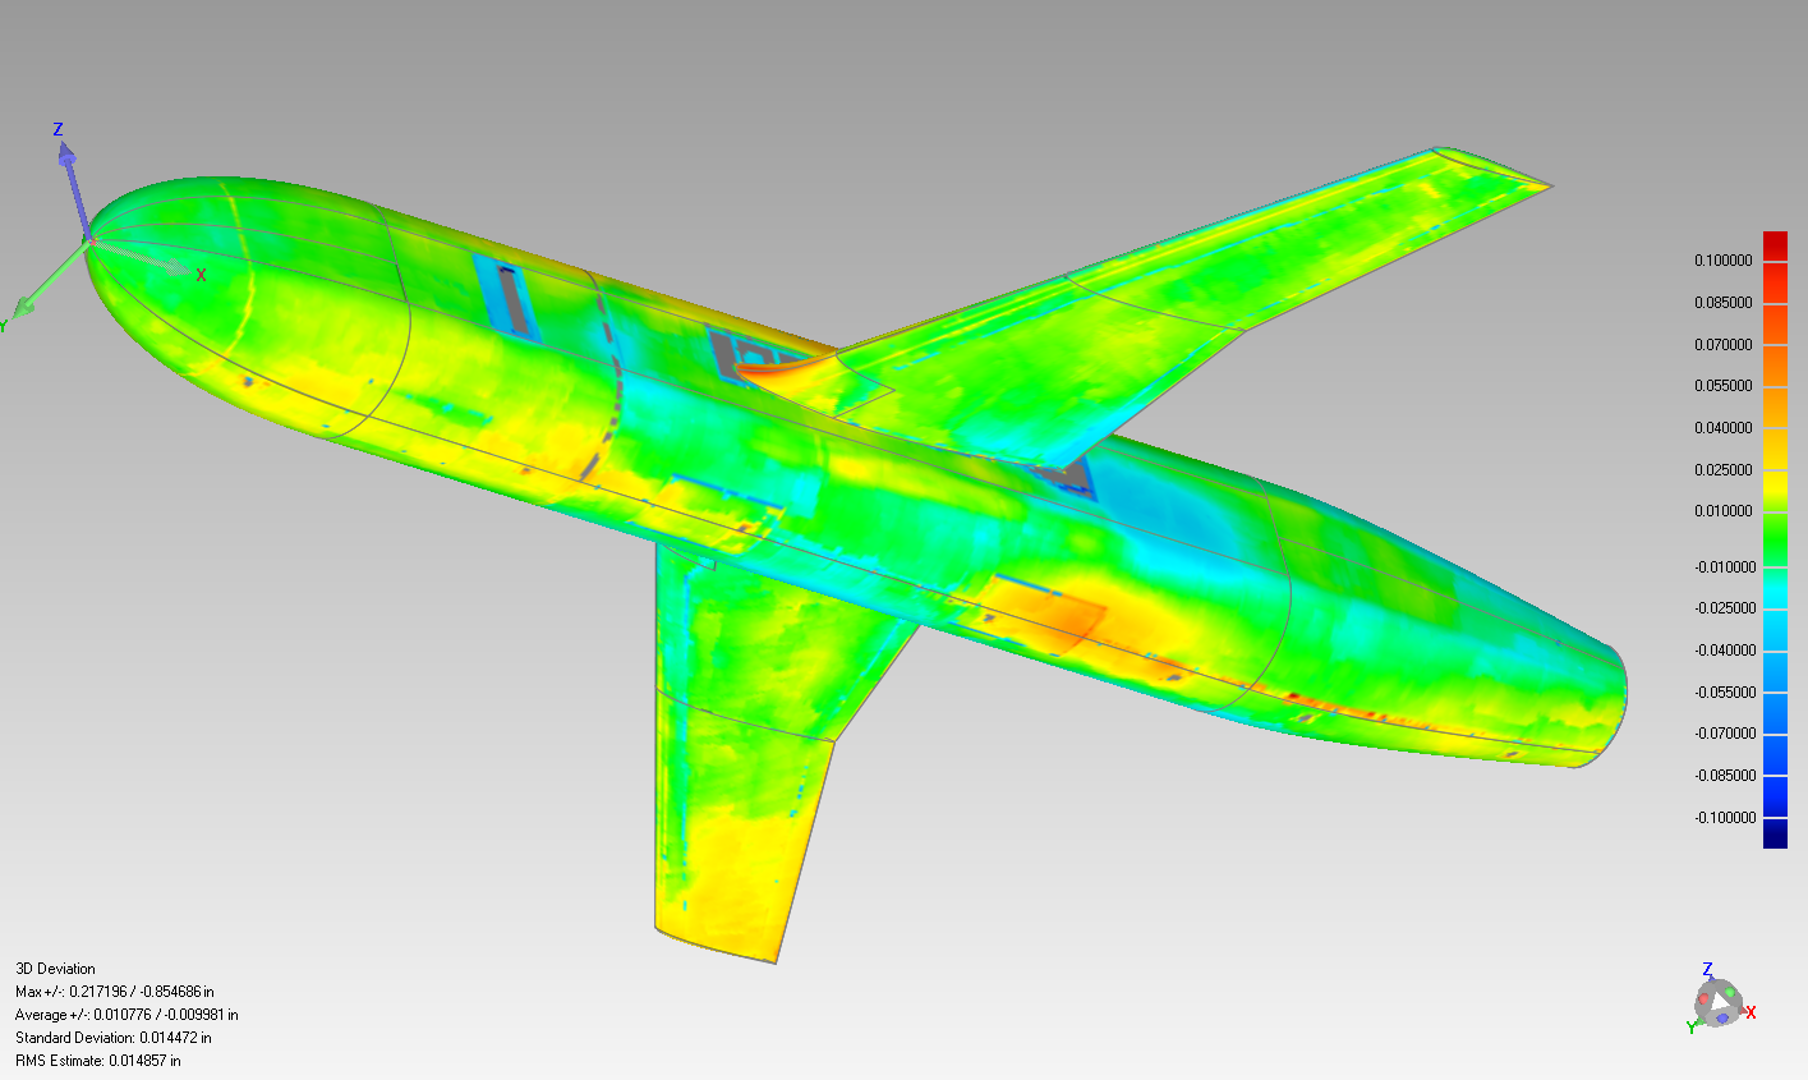
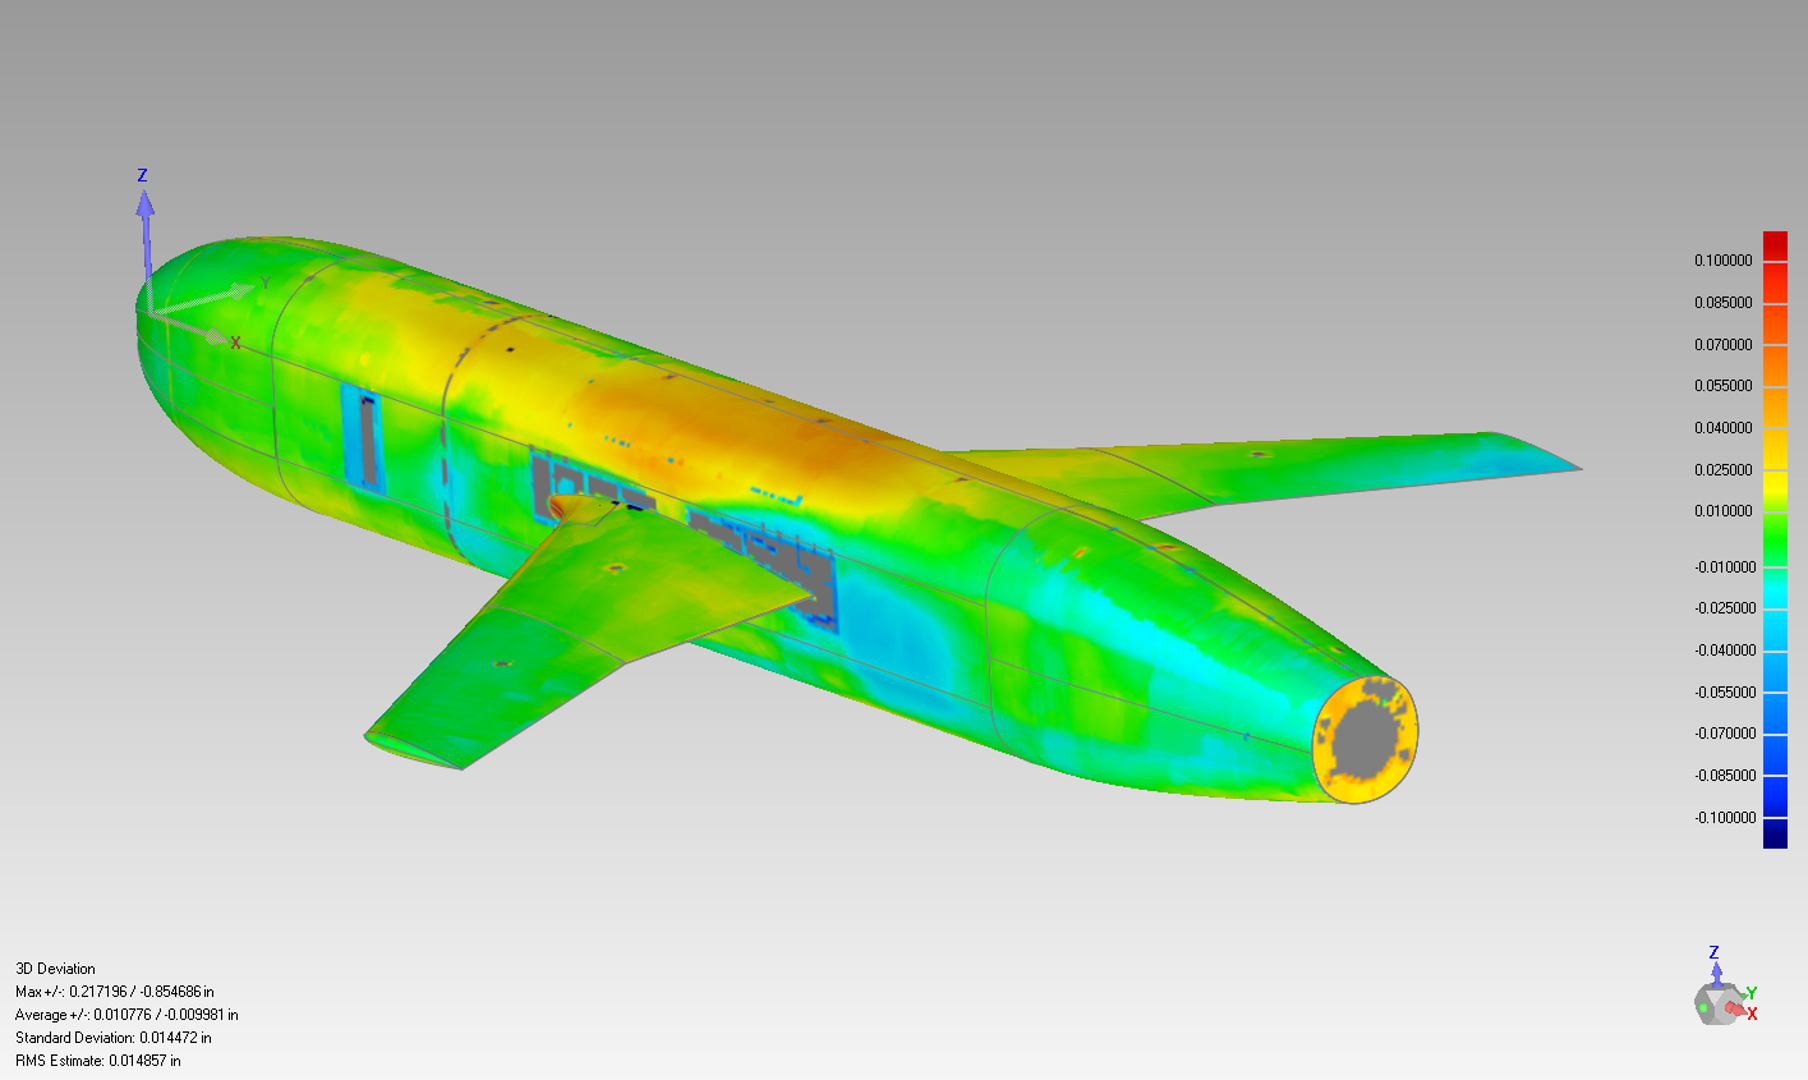
By allowing CAD software to find the "best fit", the estimated RMS deviation of the as-built shape compared
to the as-designed shape appeared to be near 0.0149 inches (0.378 mm).
This is larger than the estimated paint thickness. The reason for the difference is unknown.
As seen in the figures below, there are many regions where the scanned points
deviate from the as-designed shape by well more than the RMS deviations (deep red and dark blue colors).
Many of these larger deviations are on the fuselage, and some appear to be indicative of
hatch locations, joints, and window frames on the model. Some details regarding these are as follows:
- The nose connects to the main body of the fuselage at approximately x=1511 mm. The recessed bolts that connected the
nose cone to the main body were covered with Kapton tape.
- A large upper hatch on top of the fuselage is about 950 mm long and 434 mm wide, extending from near x=1942 to near 2892 mm.
- Three smaller lower hatches exist on the bottom of the fuselage. The front-most is on the nose cone; it is
about 400 mm long and 202 mm wide, starting near x=738 mm. The other two are each about 356 mm long and 202 mm wide, one starting near
x=1727 mm and the other starting near x=2768 mm.
- Kapton tape was also used to cover mounting holes on the port side above the windows, as well as to cover Kulite
sensors while using the LDV.
- Most of the hatches were opened/closed and the nose was removed/replaced many times during the wind tunnel entry.
- Note: the lines in the figures below do NOT represent joints in the model; they are solely representative of
geometric entities present in the CAD file.
It is not yet clear if any of the scanned differences are significant or not, from a CFD perspective.
Nor is it clear precisely how to make use of the scanned information in a CFD analysis.
The scanned points are available below. Note that the alignments of the files is somewhat random in space;
manipulation is required to get the files appropriately aligned with the as-designed CAD.
- Original raw points (in inches! you must multiply each coordinate by 25.4 to get it in mm):
Symmetric_Raw_Data.dat.gz (gzipped data file, 169.9 MB).
- STL file created from the scanned data (in inches! you must multiply each coordinate by 25.4 to get it in mm):
Symmetric_Raw_Data.stl.gz (gzipped STL file, 526.2 MB).
Recall that the STL version of the scanned points introduces some non-physical geometric behavior, and the
raw data itself includes some errant points. Also, small "pucks," which are temporarily placed on the model during the laser scanning
process, are supposed to be removed from the final raw-points file, but this is not always successful.
Pictures from scan comparisons:
Return to: Exp: NASA Juncture Flow - Intro Page for Turbulent Symmetric Wing
Return to: Exp: NASA Juncture Flow - Intro Page
Return to: Data from Experiments - Intro Page
Return to: Turbulence Modeling Resource Home Page
Privacy Act Statement
Accessibility Statement
Responsible NASA Official:
Ethan Vogel
Page Curator:
Clark Pederson
Last Updated: 08/13/2025

