 |
Langley Research CenterTurbulence Modeling Resource |
Jump to: SA Results, SSTm Results, SST-Vm Results, SSG/LRR-RSM-w2012 Results, Wilcox2006-klim-m Results, K-kL-MEAH2015m Results, EASMko2003-S Results, K-e-Rt Results
Return to: NACA 0012 Validation Intro Page
Return to: Turbulence Modeling Resource Home Page
2D NACA 0012 Airfoil Validation Case
SA-RC Results
Link to SA-RC equations
Note that thorough
grid studies were not performed for validation cases such as this one.
Some effort was made to ensure reasonable grid resolutions, but there may still be
small noticeable discretization errors. Therefore, these validation results shown should be considered
representative, but not "truth."
(See the NACA 0012 Numerical Analysis Case for a
representative verification exercise of this airfoil case.)
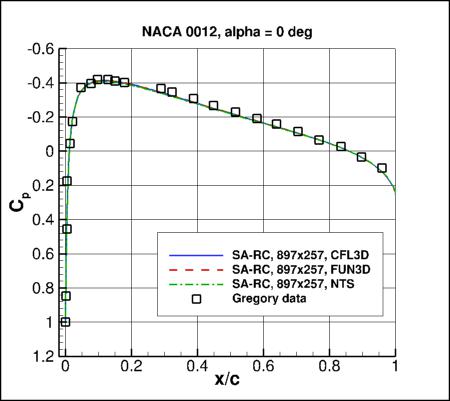
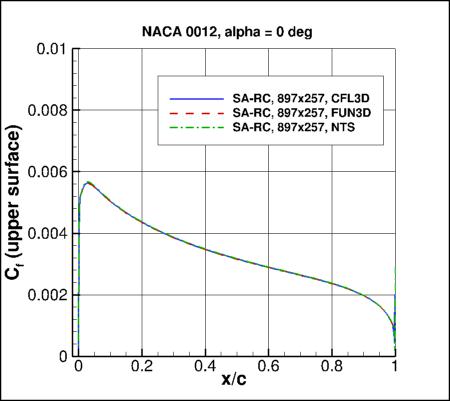
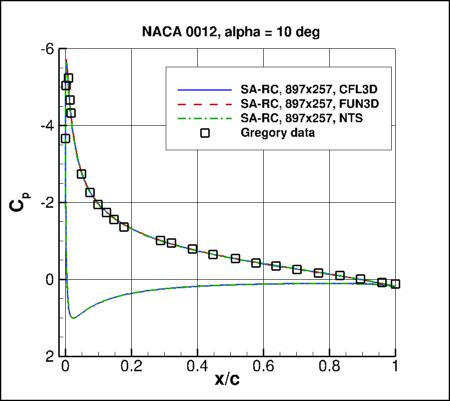
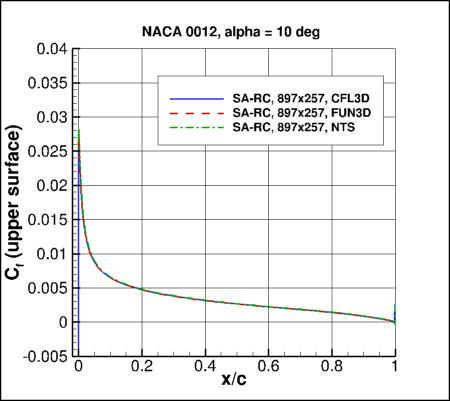
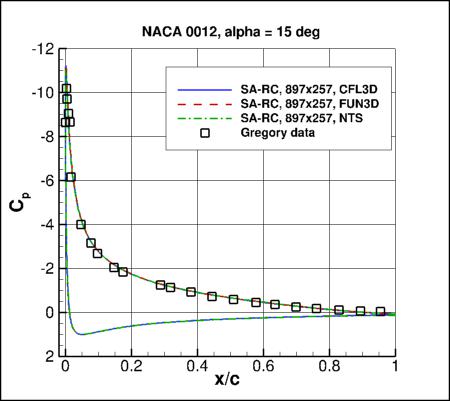
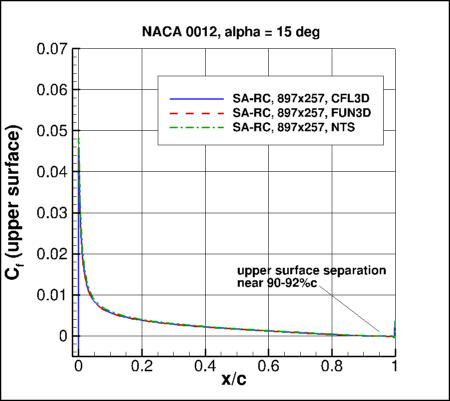
Above SA-RC results are from CFL3D, FUN3D, and NTS
on the 897x257 grid.
All three codes used used freestream value of the SA turbulence field variable (relative to laminar)=3.
Please read note 5 on Notes on running CFD page.
Results are overall very close between the three codes, with the largest
difference seen in drag at alpha=15 deg (less than 3% difference).
These discrepancies between codes are due to discretization errors,
boundary condition differences, and/or
possible code-to-code implementation-detail differences.
See NACA 0012 Numerical Analysis Page for more discussion
about numerical issues associated with the NACA 0012 airfoil case.
Note that these are compressible code results
at "essentially incompressible" conditions of M=0.15.
There may be a very small influence of compressibility.
Only the CFD data files from CFL3D's SA-RC results are given here for reference:
n0012clcd_cfl3d_sarc.dat,
n0012cp_cfl3d_sarc.dat, and
n0012cf_cfl3d_sarc.dat.
A typical CFL3D input file is:
n0012_cfl3d_typical_sarc.inp.
A typical FUN3D input file is:
fun3d.nml_typical_sarc_2.
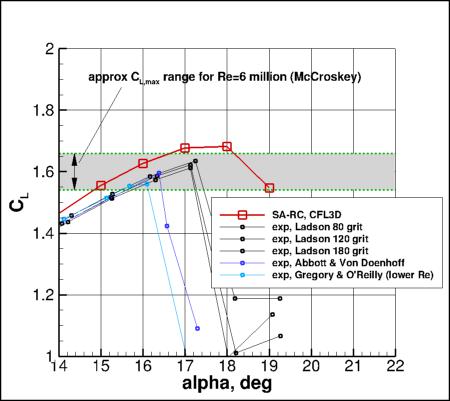
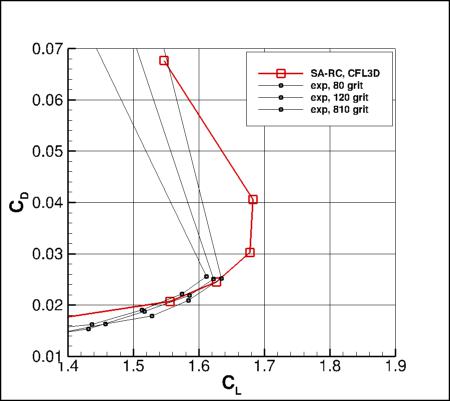
Behavior of model near CLmax:
The behavior of the SA-RC model near maximum lift for this 2-D case is shown in the following plots (CFL3D only).
The cases were run every 1 deg (starting at 15 deg.), at least until CL,max was approximately attained.
An approximate CL,max range from experiments (McCroskey, AGARD CP-429, July 1988; also NASA TM 100019, October 1987)
is highlighted in the first plot by green dashed lines.
Note, however, that experimental data near maximum lift no doubt contains a significant degree of three-dimensionality.
Also, these CFD results are still on the 897x257 grid, and there is likely to be significantly more grid sensitivity
for the higher angles of attack than for the lower angles of attack shown above. Therefore, the results below
should only be viewed qualitatively.
Jump to: SA Results,
SSTm Results,
SST-Vm Results,
SSG/LRR-RSM-w2012 Results,
Wilcox2006-klim-m Results,
K-kL-MEAH2015m Results,
EASMko2003-S Results,
K-e-Rt Results Return to: NACA 0012 Validation Intro Page Return to: Turbulence Modeling Resource Home Page
Recent significant updates: Responsible NASA Official:
Ethan Vogel
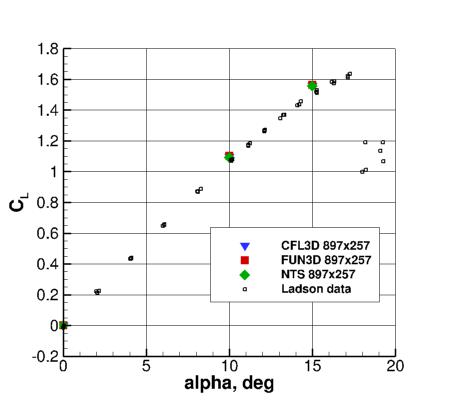
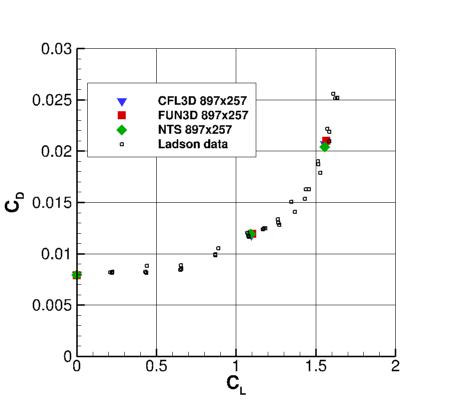
CODE
CL (alpha=0)
CL (alpha=10)
CL (alpha=15)
CD (alpha=0)
CD (alpha=10)
CD (alpha=15)
CFL3D
approx 0
1.0947
1.5560
0.00793
0.01179
0.02066
FUN3D
approx 0
1.1020
1.5651
0.00790
0.01191
0.02099
NTS
approx 0
1.0933
1.5562
0.00792
0.01193
0.02043
07/05/2016 - added NTS results
Page Curator:
Clark Pederson
Last Updated: 03/04/2025