The purpose here is to provide a
validation case for turbulence models. Unlike verification, which seeks to
establish that a model has been implemented correctly, validation compares
CFD results against data in an effort to establish a model's ability to
reproduce physics. A Fortran program to create nested grids of the same family is
provided here if desired. Data are also provided for comparison. For this
particular supersonic square duct
case (from Davis and Gessner), the data are from experiments.
The experiment utilizes a constant area square duct of height and width D=25.4 mm, with
length x/D=50.
The primary focus of this case is to assess turbulence models for internal duct flow with
corners. In such cases, turbulent anisotropies can be important because normal stress differences
induce flowfield behavior that cannot be captured with models that make use of the
Boussinesq assumption.
The reference Mach number is 3.9, and the flow develops over a length of 50 D.
As we are interested in comparing data at 50 D, the CFD grid is made slightly longer: 52 D.
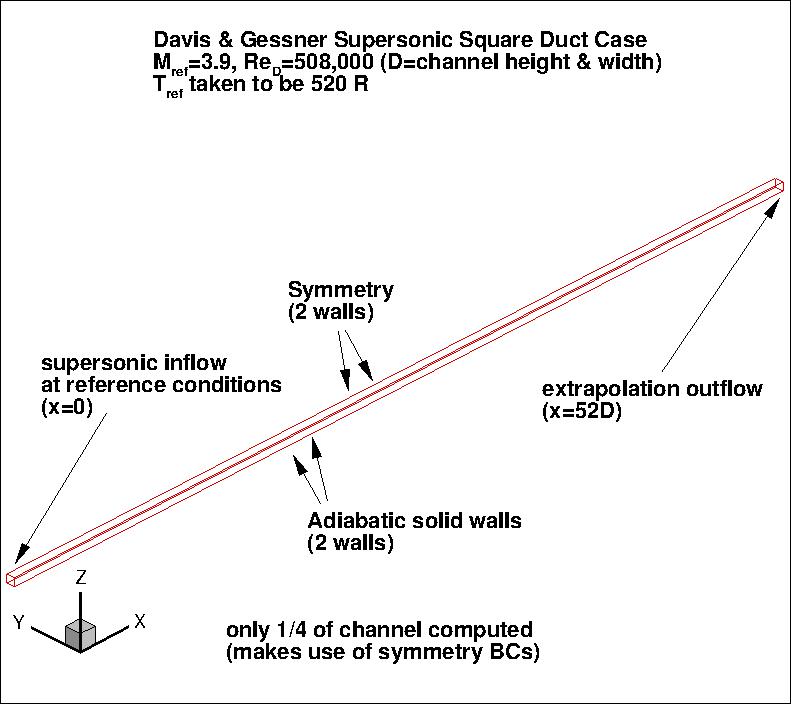
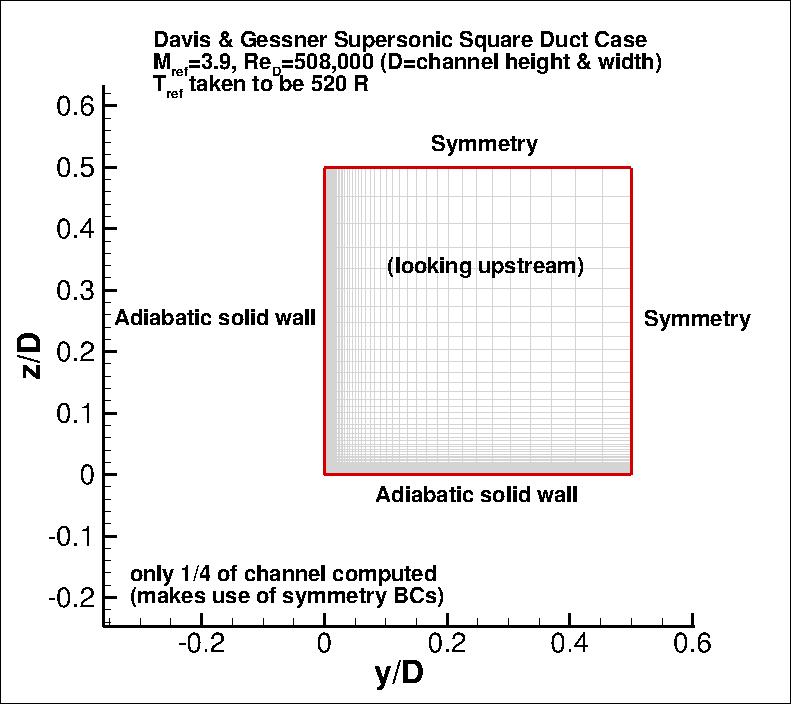
The walls of the duct are modeled as adiabatic solid walls, although due to symmetry only
one quarter of the duct is computed, and symmetry boundary conditions are applied on two boundaries.
The following plots shows the layout of this case, along with the boundary conditions.
(Note that particular variations of the BCs at the inflow and outflow boundaries
may also work and yield similar results for this problem.)
Note: at high Mach numbers (e.g., M > 2), CFD transition to fully turbulent wall-bounded flow can be delayed
compared with flow at lower M. Also, the delayed transition location can vary significantly with
the freestream levels set. See, for example, Journal of Spacecraft and Rockets, Vol. 47, No. 1, 2010, pp. 11-20 and
AIAA Journal, Vol. 47, No. 4, 2009, pp. 982-993 (which is based on
AIAA Paper 2008-4403).
For this test case, results are only plotted for regions of the flow that were fully turbulent.
GRIDS
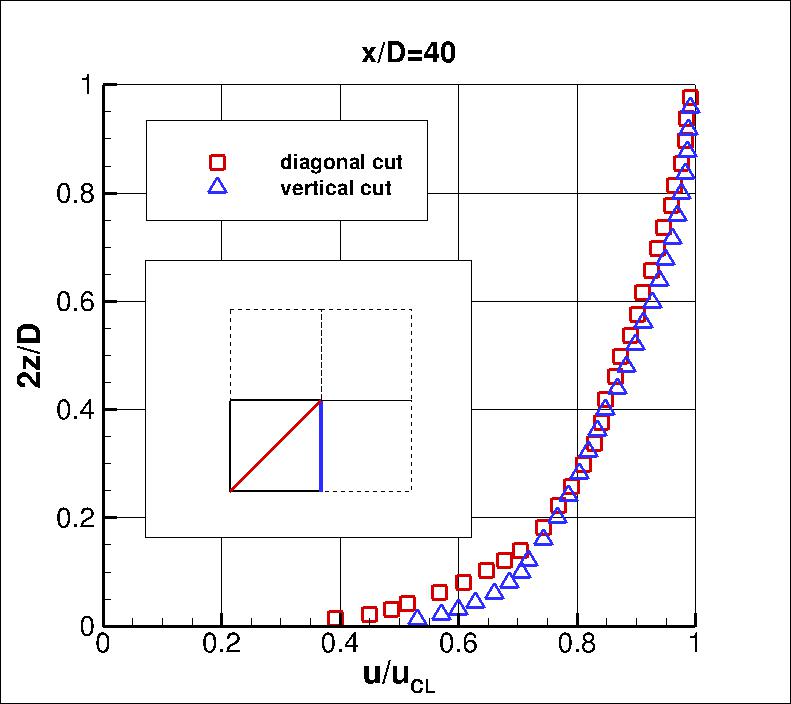
Some of the experimental data for this case will be shown below.
The profiles highlighted here are near the downstream end of the duct at x/D=40 and 50, with a particular focus at x/D=50.
The experimental data reference is: Davis, D. O. and Gessner, F. B.,
"Further Experiments on Supersonic Turbulent Flow Development in a Square Duct,"
AIAA Journal, Vol. 27, No. 8, August 1989, pp. 1023-1030,
https://doi.org/10.2514/3.10216.
Note that
skin friction coefficient values are given here based on Uref and rhoref, for
convenience when comparing against CFD results. However, the original reference
gives Cf based on local edge velocity and edge density. The translation was accomplished using
approximate values taken from figs. 8 and 11(b) of the reference. Also note that all of the
experimental data provided here were digitized from figures in the reference, so they should be used with caution.
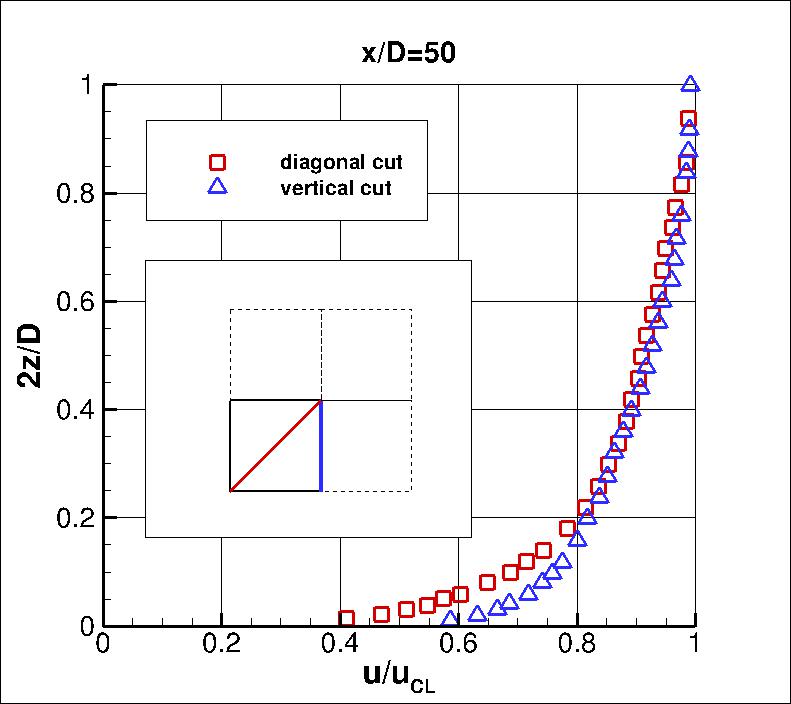
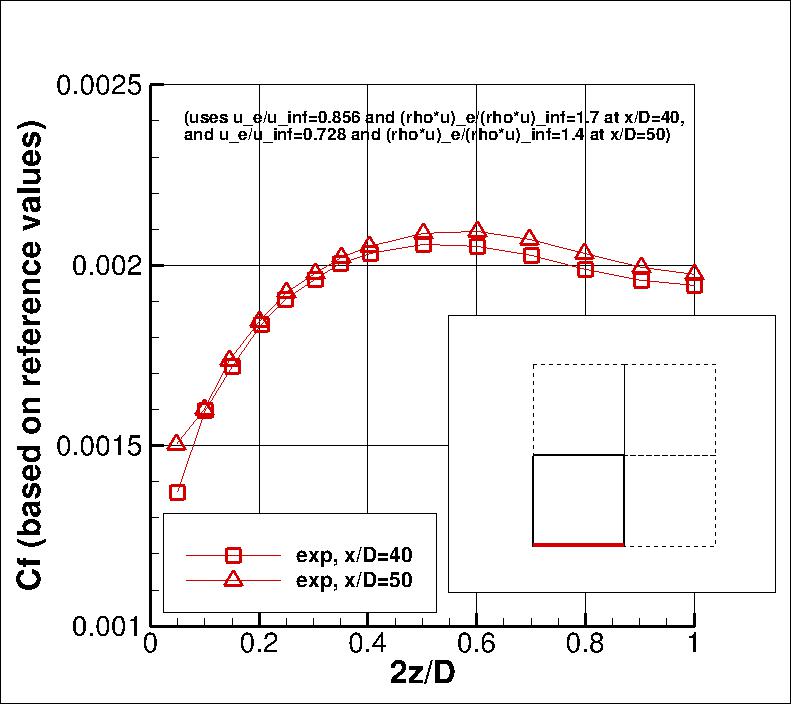
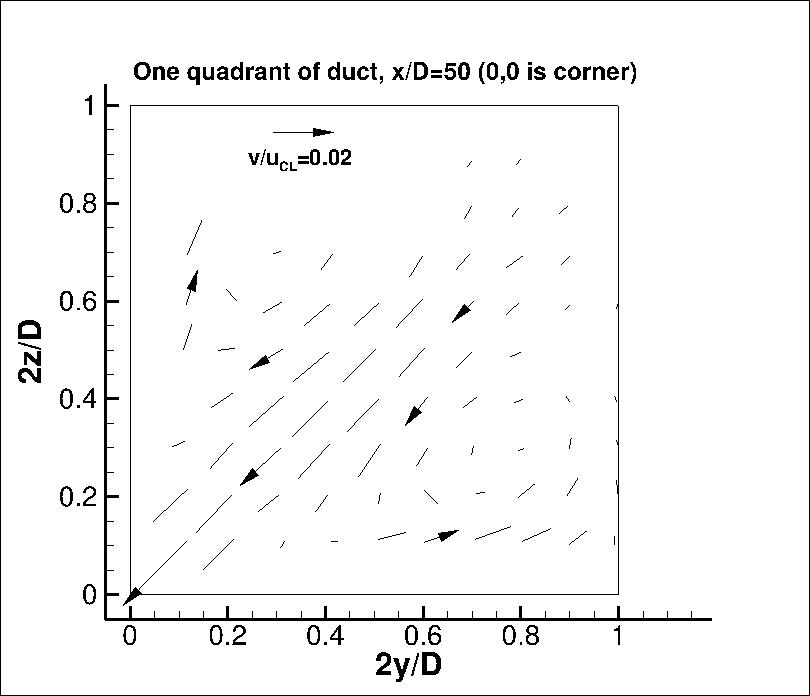
A main focus of this case is the ability (or lack thereof) of the turbulence models to capture the
secondary flow features. Within a given x=constant plane, the in-plane flow should exhibit flow from the
channel center region toward the corners,
with two counter-rotating vortical features within each quadrant. The following figure is a very crude
representation of the in-plane velocity vectors from fig 5(b) of the experimental reference, showing
one quadrant of the duct at x/D=50.
This is only an approximation achieved by tracing over parts of the original figure; see the original reference
for more details.
The experimental data for most of the plots above can be found in the following files:
uprofiles_exp.dat,
cfinf_exp.dat.
What to Expect:
(Other turbulence model results may be added in the future.)
Note that the OVERFLOW code has documented its results for this validation case (for the SA-noft2, SA-noft2-QCR2000, SST, and SST-QCR2000
turbulence models) in NAS Technical Paper 2016-01 (pdf file)
(18.3 MB) by Jespersen, Pulliam, and Childs.
Return to: Turbulence Modeling Resource Home Page
Recent significant updates:
03/21/2023 - mentioned possible delay in transition to fully turbulent flow at higher M
Privacy Act Statement
Accessibility Statement
Responsible NASA Official:
Ethan Vogel
Page Curator:
Clark Pederson
Last Updated: 03/21/2023
