Return to: 2D NACA 0012 Airfoil Validation for Numerical Analysis SA Model Results Intro Page
Return to: 2D NACA 0012 Airfoil Validation for Numerical Analysis Intro Page
Return to: Turbulence Modeling Resource Home Page
TURBULENCE MODEL NUMERICAL ANALYSIS
2D NACA 0012 Airfoil Validation for Turbulence Model Numerical
Analysis
SA Model Results
without Point Vortex BC
for M = 0.15, Rec = 6 million, alpha = 10 deg, Tref = 540 R
Link to SA equations
All results shown on this page use a "standard" Riemann-invariant farfield BC.
For results that include a farfield point vortex BC, go to:
2D NACA 0012 Airfoil Validation for Turbulence Model
Numerical Analysis - SA Model Results with Point Vortex BC.
The results on this page have been reported in
AIAA Journal, Vol. 54, No. 9, 2016, pp. 2563-2588,
https://doi.org/10.2514/1.J054555 and AIAA Paper 2015-1746,
https://doi.org/10.2514/6.2015-1746.
Also, many of the other papers from two special sessions at AIAA SciTech 2015 dealt with this case: see
AIAA Papers 2015-1529 through 1532, and AIAA Papers 2015-1744 through 1747.
There is also an independent analysis provided in
NASA-TM-2018-220106,
and later verification in AIAA-2021-1080,
https://doi.org/10.2514/6.2021-1080.
Grid Convergence Behavior of Forces/Moment on Different Families
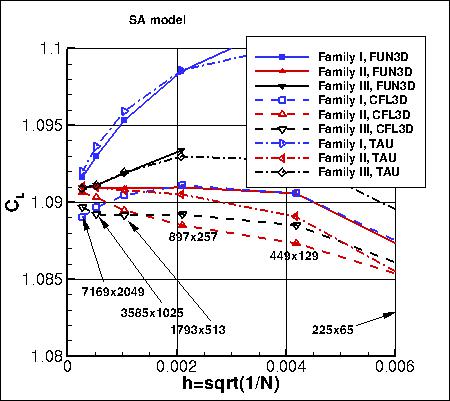
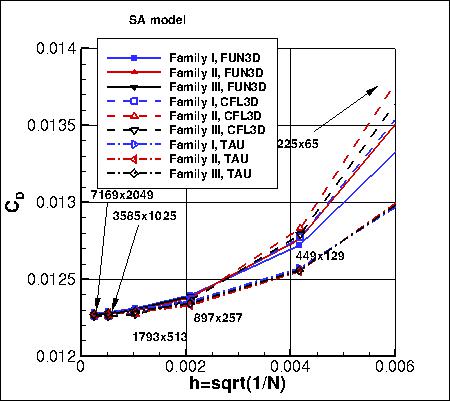
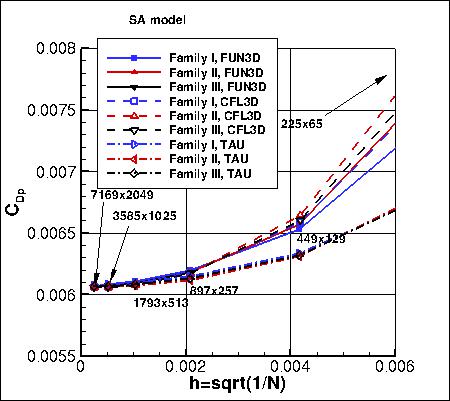
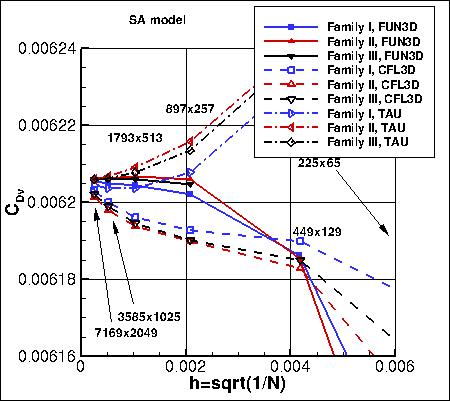
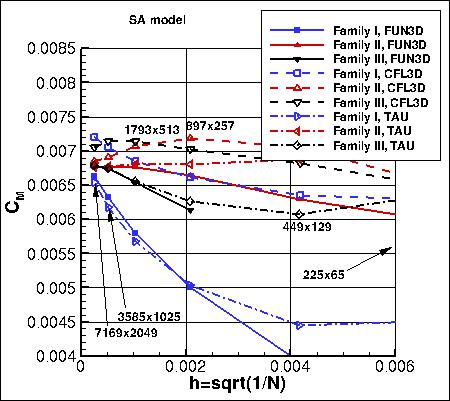
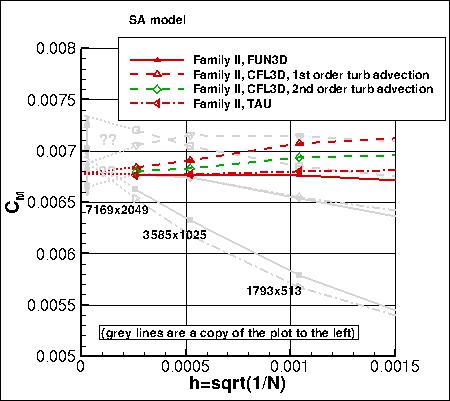
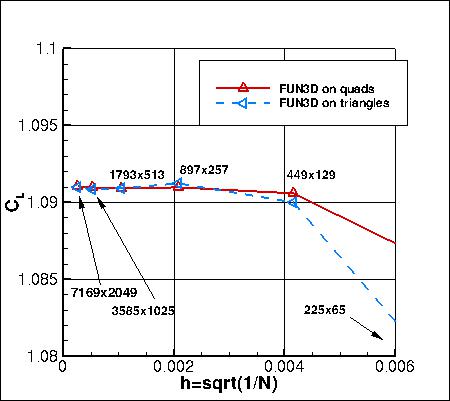
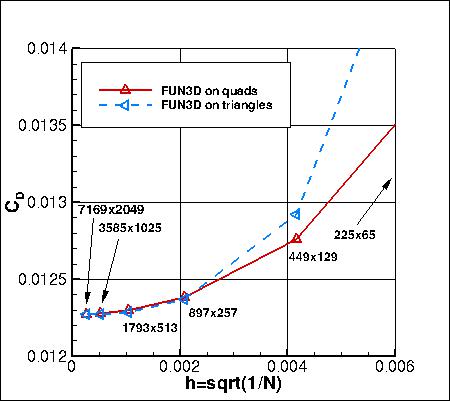
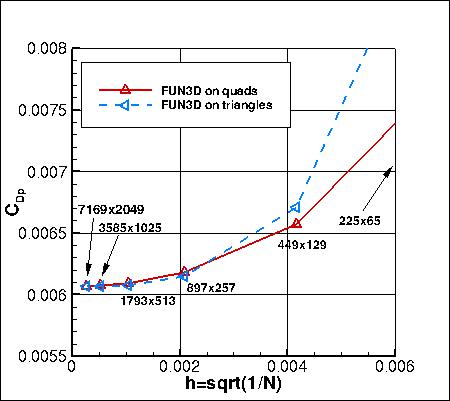
Plots are shown to illustrate grid convergence for the lift, drag, and pitching moment coefficients.
The contributions to the drag coefficient due to the viscosity and pressure are presented separately.
The pitching moment is computed with respect to the 0.25c point.
Unless otherwise noted, CFL3D was run with its default setting of 1st order for turbulence advection,
whereas FUN3D and TAU were run with 2nd order for turbulence advection.
Recall that CFL3D was run with the
SA model; both FUN3D and TAU used
SA-neg.
Results that generated the above plots can be found in the following data files:
fun3d_results_sa_nopv_withN.dat,
cfl3d_results_sa_nopv_withN.dat, and
tau_results_sa_nopv_withN.dat (all updated 2/8/2016).
As noted above, CFL3D was generally run with its default setting of 1st order
for turbulence advection. It was also run using 2nd order for turbulence advection for
grid family II only; those results are provided in
cfl3d_results_sa_nopv_2ndorderturbadvection_withN.dat (updated 2/8/2016) (shown in several plots below).
It has been found that the trailing edge streamwise (TES) spacing has a profound influence on the NACA 0012 lift and moment
results. It is believed that the grid family II yields the most accurate results. Grid family II
results from FUN3D, CFL3D, and TAU (in red) are reasonably consistent with each other.
Summary of Fine Grid Variations (from 3 different codes):
Value
|
All families actual
|
All families relative %
|
Family II actual
|
Family II relative %
|
CL
|
1.088 - 1.092
|
0.37
|
1.09085 - 1.09103
|
0.016
|
CD
|
0.01226 - 0.01228
|
0.16
|
0.0122715 - 0.0122740
|
0.02
|
CM
|
0.0065 - 0.0072
|
10
|
0.00677 - 0.00680
|
0.4
|
CDp
|
0.006056 - 0.006072
|
0.26
|
0.006066 - 0.006068
|
0.03
|
CDv
|
0.006201 - 0.006206
|
0.08
|
0.0062057 - 0.0062061
|
0.006
|
Uncertainty Estimates and Infinite Grid Results:
Using the uncertainty estimation procedure from the Fluids Engineering Division of the ASME
(Celik, I. B., Ghia, U., Roache, P. J., Freitas, C. J., Coleman, H., Raad, P. E.,
"Procedure for Estimation and Reporting of Uncertainty Due to Discretization in CFD Applications,"
Journal of Fluids Engineering, Vol. 130, July 2008, 078001, https://doi.org/10.1115/1.2960953), described in Summary of Uncertainty Procedure, one can analyze the grid convergence of forces and moment in greater detail.
For Family II, the finest 3 grids yield the following:
| Code |
Computed apparent order, p |
Approx rel fine-grid error, ea21 |
Extrap rel fine-grid error, eext21 |
Fine-grid convergence index, GCIfine21 |
phi_ext_21 = extrapolated value |
| CL |
| FUN3D (2nd order turb advection) |
2.18 |
0.002% |
0.001% |
0.001% |
1.09102722 |
| TAU (2nd order turb advection) |
2.15 |
0.004% |
0.001% |
0.002% |
1.09104043 |
| CFL3D (2nd order turb advection) |
2.01 |
0.013% |
0.004% |
0.005% |
1.09090004 |
| CFL3D (1st order turb advection) |
1.38 |
0.030% |
0.019% |
0.023% |
1.09085139 |
| CD |
| FUN3D (2nd order turb advection) |
2.04 |
0.039% |
0.013% |
0.016% |
0.0122724643 |
| TAU (2nd order turb advection) |
2.09 |
0.019% |
0.006% |
0.007% |
0.0122725244 |
| CFL3D (2nd order turb advection) |
2.23 |
0.038% |
0.010% |
0.013% |
0.0122702792 |
| CFL3D (1st order turb advection) |
oscillatory convergence |
0.023% |
N/A |
N/A |
0.0122632717 |
| CDp |
| FUN3D (2nd order turb advection) |
2.09 |
0.074% |
0.023% |
0.086% |
0.00606674064 |
| TAU (2nd order turb advection) |
2.29 |
0.026% |
0.007% |
0.008% |
0.00606676105 |
| CFL3D (2nd order turb advection) |
2.24 |
0.078% |
0.021% |
0.026% |
0.00606449412 |
| CFL3D (1st order turb advection) |
5.02 |
0.008% |
< 0.001% |
0.317% |
0.00606110301 |
| CDv |
| FUN3D (2nd order turb advection) |
0.98 |
0.005% |
0.005% |
0.007% |
0.00620556081 |
| TAU (2nd order turb advection) |
1.56 |
0.013% |
0.006% |
0.008% |
0.00620568293 |
| CFL3D (2nd order turb advection) |
3.07 |
0.001% |
< 0.001% |
0.007% |
0.00620579011 |
| CFL3D (1st order turb advection) |
0.33 |
0.052% |
0.204% |
0.148% |
0.00621386447 |
| Cm |
| FUN3D (2nd order turb advection) |
0.94 |
0.009% |
0.009% |
0.012% |
0.00676640573 |
| TAU (2nd order turb advection) |
2.17 |
0.111% |
0.032% |
0.040% |
0.00676318977 |
| CFL3D (2nd order turb advection) |
1.97 |
0.401% |
0.138% |
0.172% |
0.00679485924 |
| CFL3D (1st order turb advection) |
1.35 |
0.941% |
0.611% |
0.759% |
0.00680285492 |
It is evident from the above chart that it is important to use 2nd order turbulence advection (as opposed to
1st order) if one is interested in achieving a higher accuracy (lower GCI) on a given grid.
Using the results with 2nd order turbulence advection,
the results appear to be approaching infinitely-refined results bounded by:
- CL = 1.0909 - 1.0911
- CD = 0.012270 - 0.012275
- CDp = 0.006060 - 0.006070
- CDv = 0.006205 - 0.006206
- Cm = 0.00676 - 0.00680
However, note that this is an imprecise analysis, as the results are not all definitively demonstrating a clear
consistent "asymptotic" rate of convergence.
More Details on Grid Convergence Behavior of Forces/Moment
on Different Families (Including Effect of 1st vs. 2nd Order Turb Advection for Family II)
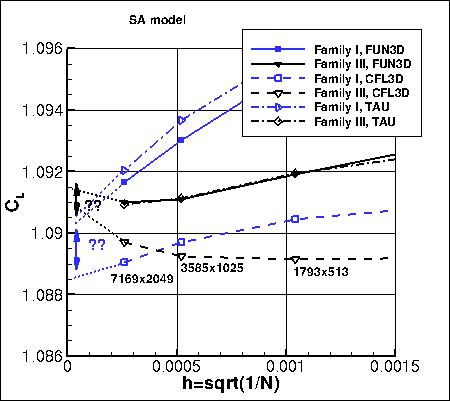
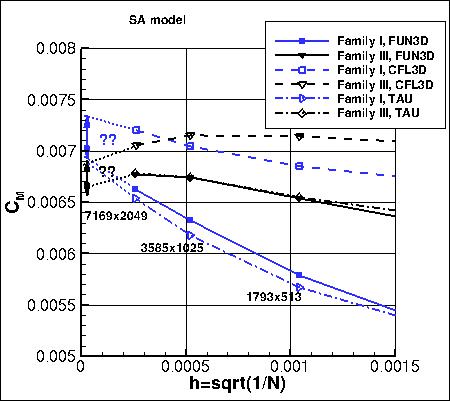
Grid family I solutions appear to be approaching different values for lift and moment coefficients as
the grids are refined. See zoomed-in plots for CL and CM below.
It is believed that much finer grids than 7169x2049 would be required
for grid family I to start to converge to the correct results.
As seen in the plots, solutions on the family III grids, which have TES spacing between family I
and II, are only just starting to turn toward the correct results for lift and moment on the 7169x2049 grid.
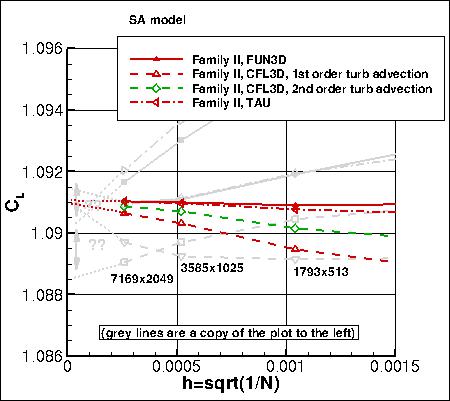
The difference between 1st vs 2nd order treatment of the turbulence advection terms
in CFL3D is also shown for CL and CM in the plots for grid family II.
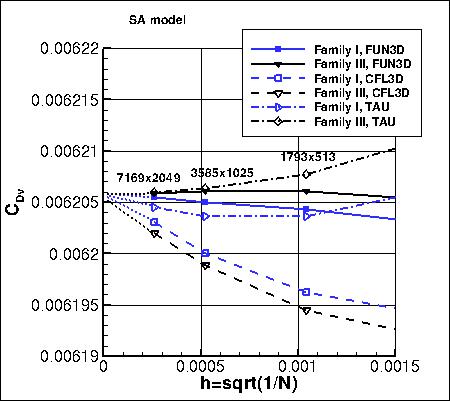
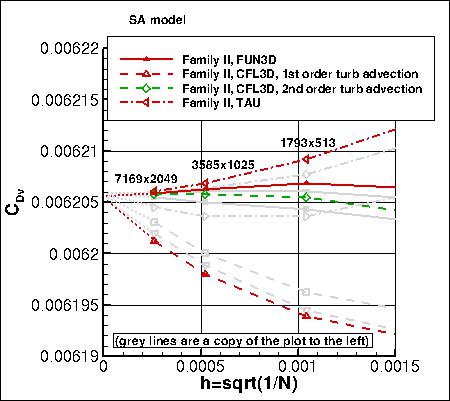
Although the viscous drag coefficient shows reasonably
consistent behavior (heading toward approximately the same solution) on all grid families,
it turns out the the turbulence advection order (1st order vs. 2nd order) makes a noticeable difference in how it
converges toward the grid-refined result, as seen in the plot below on the right (compare the green dashed line with
the red dashed line).
Effect of Triangles vs. Quads on Family II
Grid Convergence Behavior
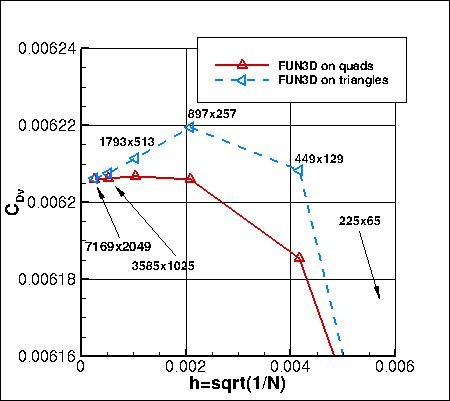
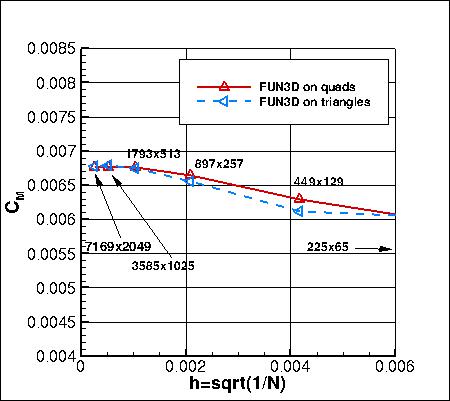
FUN3D was also run on Family II triangular grids (Family II
grids with the quads cut into triangles across the diagonal). Results are shown below
in comparison to the results on the original Family II quad grids. With 2nd order turbulence advection used,
computing on triangles generally yields comparable accuracy to results on quads (beyond the very coarsest grid). Although
not shown here, results on Family I triangles show significantly less accuracy on a given grid level
than on Family I quads. In other words, grid density distribution (clustering and location of grid points)
near the sharp trailing edge appears to be the most critical factor, and not grid topology such as quads vs. tets.
FUN3D results on triangles that generated the above plots can be found in the following data file:
fun3d_results_sa_nopv_triangles_withN.dat (updated 2/8/2016).
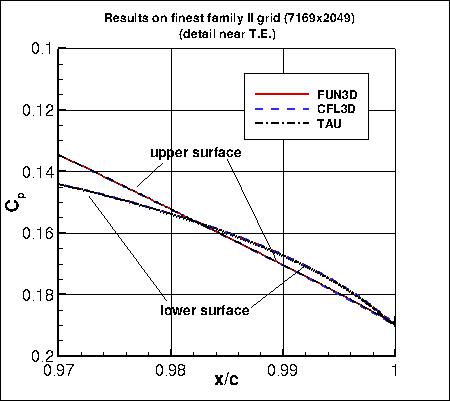
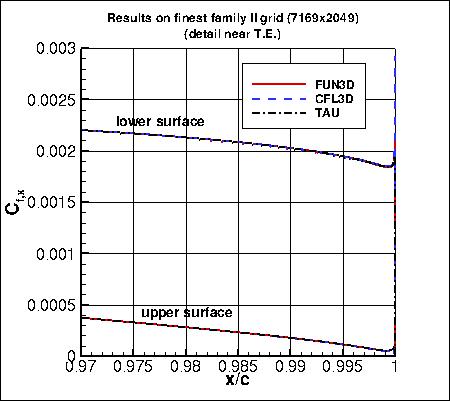
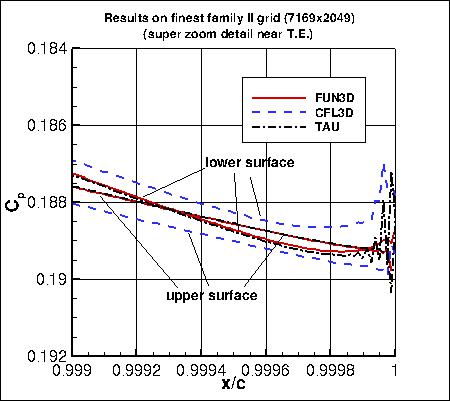
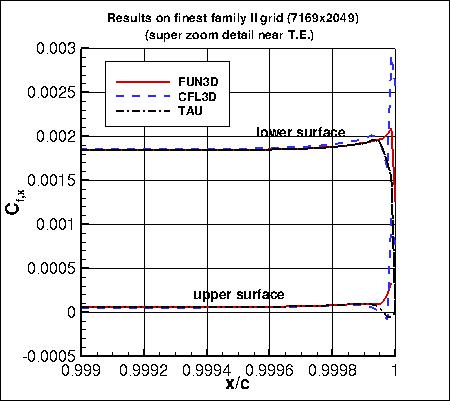
Cp and Cf,x on Finest Family II Grid
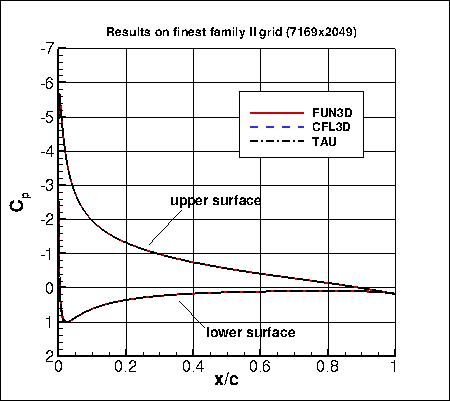
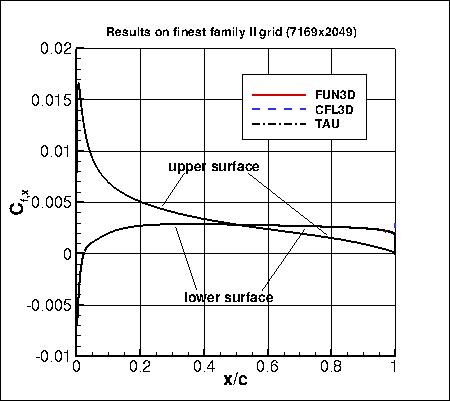
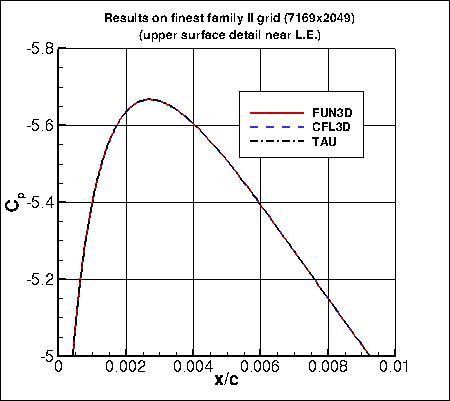
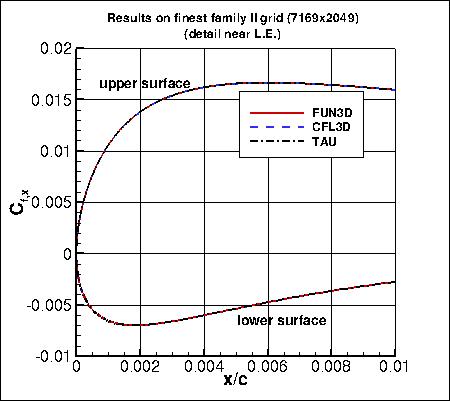
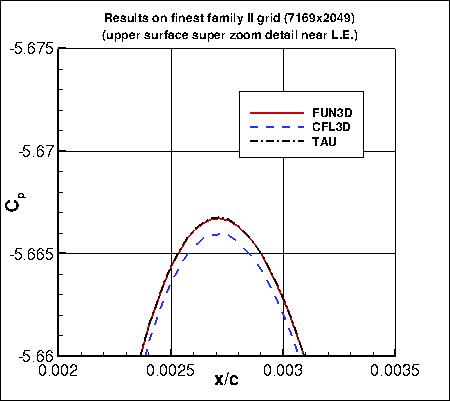
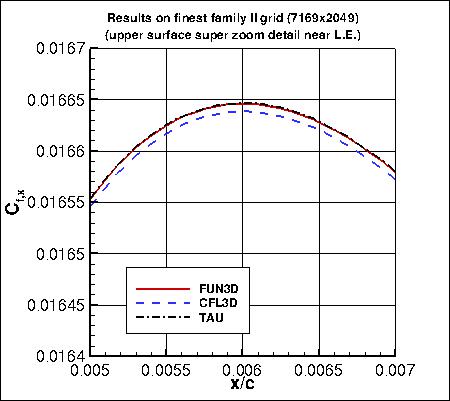
Surface Cp (pressure coefficient) and Cf,x (x-direction component of skin friction coefficient)
are shown from all three codes on the 7169x2049 family II grid in the
following figures. In these figures, CFL3D results are shown using 2nd order
for turbulence advection, although using 2nd vs. 1st order did not make very much difference in these quantities.
The largest differences between the codes occur at the suction peak and very near the trailing edge, and
are visible only in extreme zooms.
Results that generated the above plots can be found in the following data files:
fun3d_cp_sa_nopv.dat,
cfl3d_cp_sa_nopv_corrected.dat (updated 5/18/2018),
tau_cp_sa_nopv.dat,
fun3d_cf_sa_nopv.dat,
cfl3d_cf_sa_nopv.dat,
tau_cf_sa_nopv.dat
(all files updated between 7/15/2015 - 7/21/2015, to include coarser grid results).
Notice that above, Cf,x has been plotted, which is the x-direction component of
skin friction. In the data files, Cf,z and Cf are also provided. The definition
of Cf is given on the page:
Notes on Running the Cases with CFD (note 6).
Various Profiles Along Different
Lines on Finest Four Grids from Family II
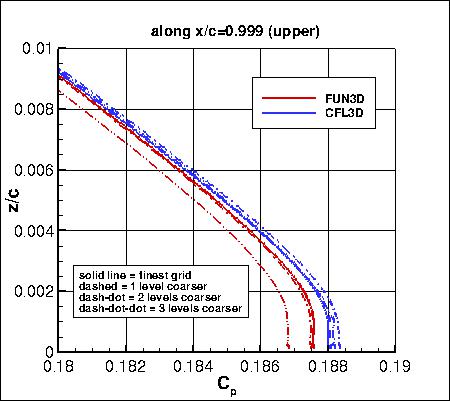
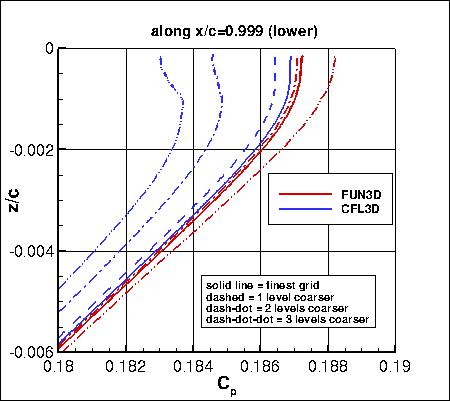
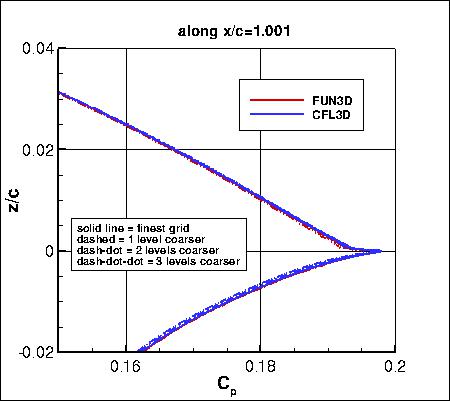
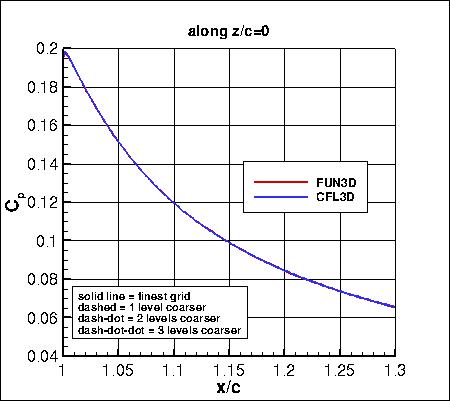
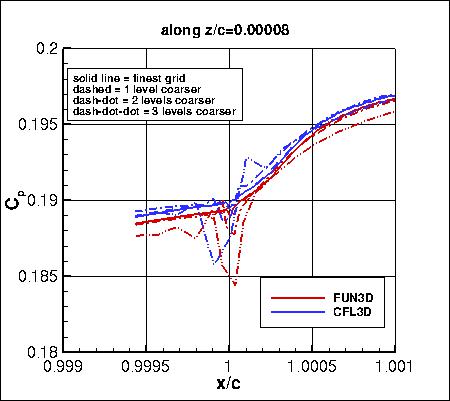
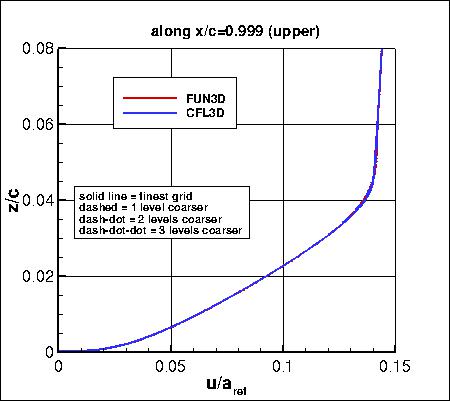
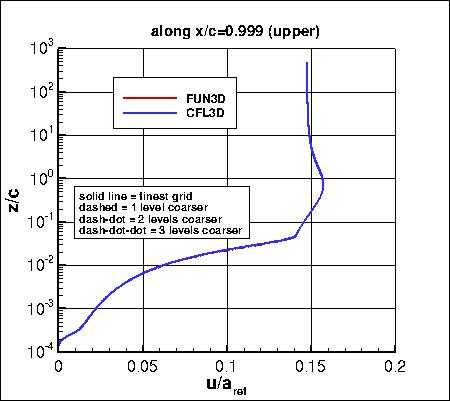
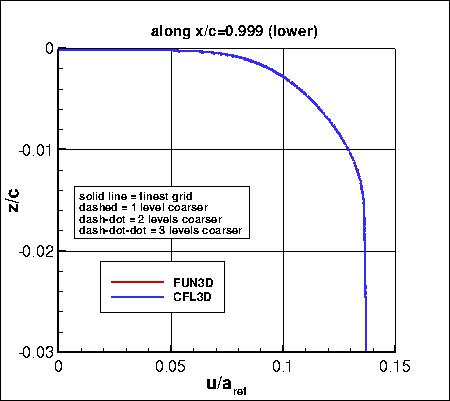
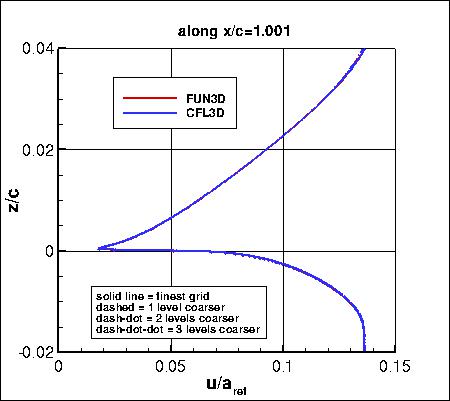
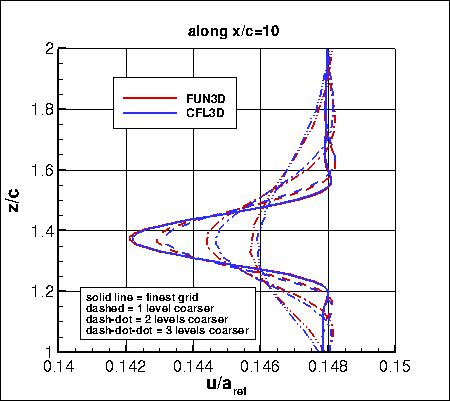
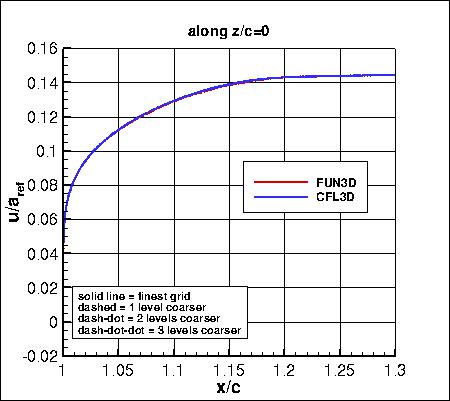
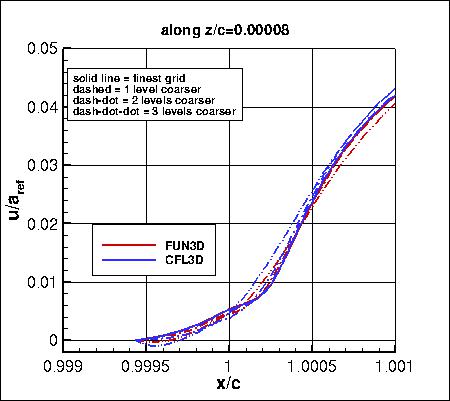
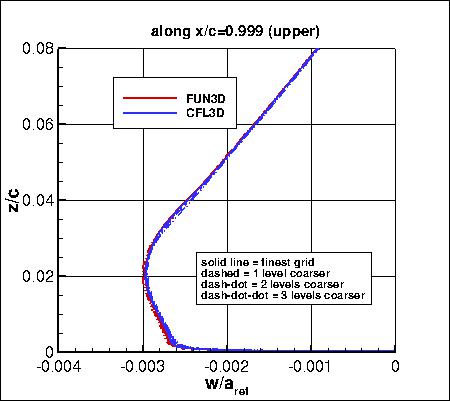
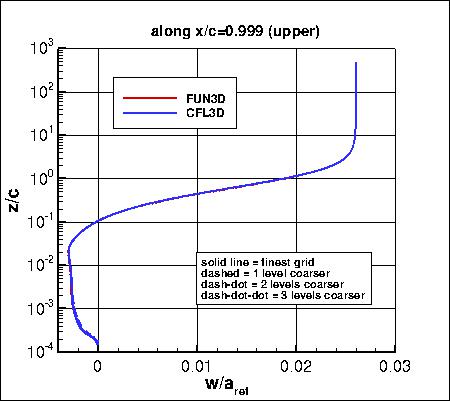
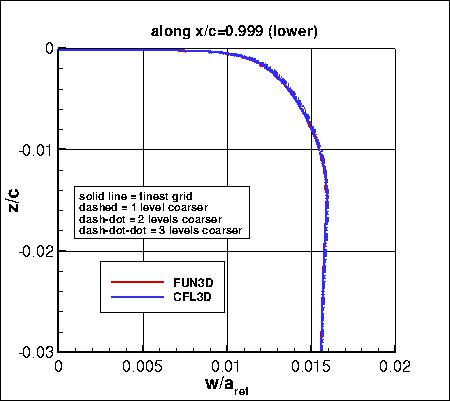
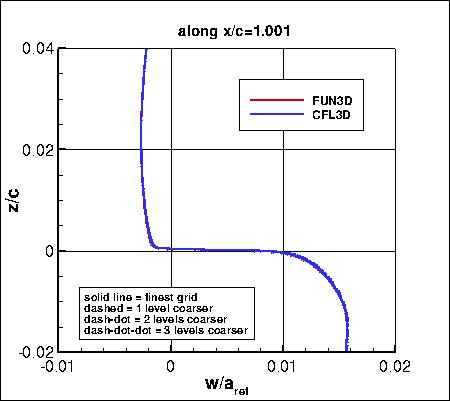
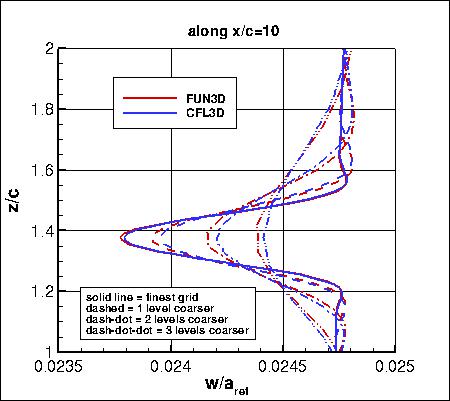
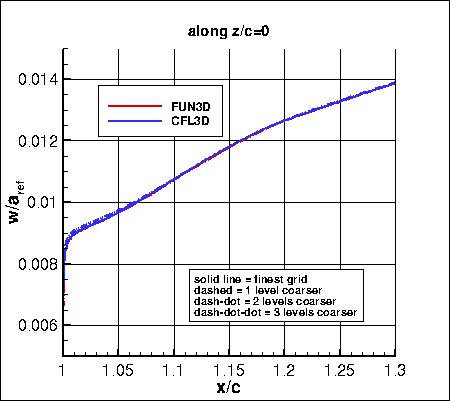
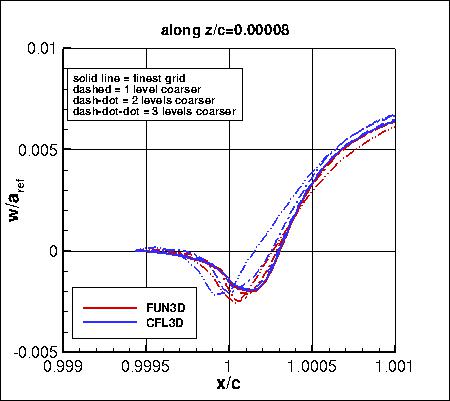
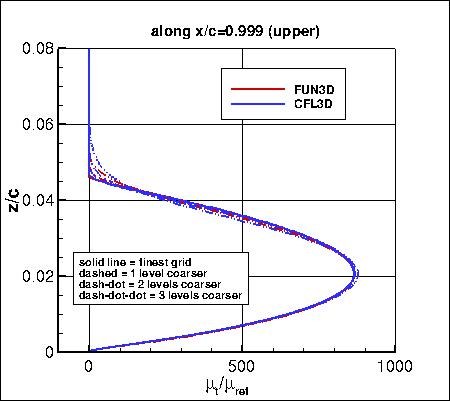
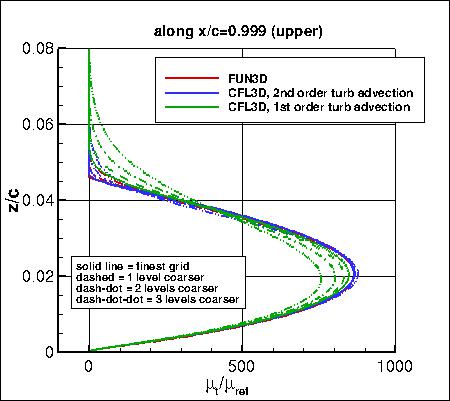
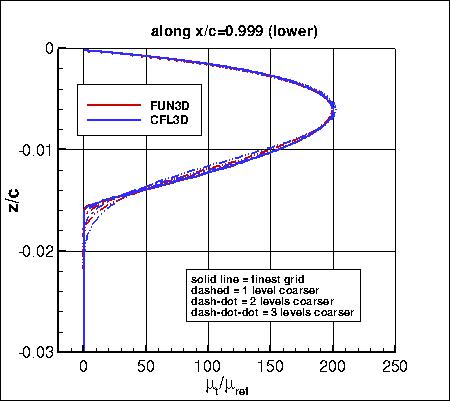
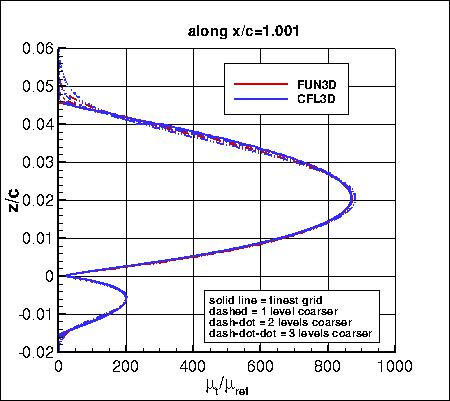
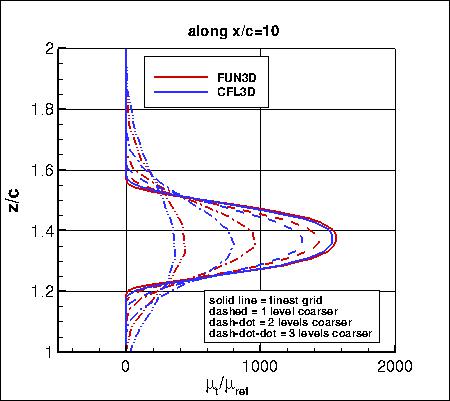
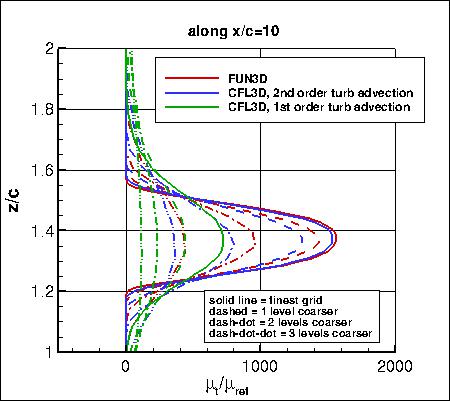
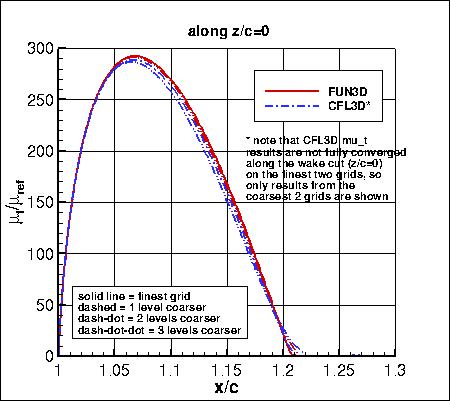
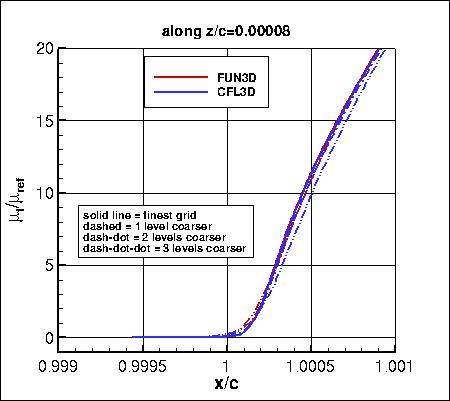
Many different profiles are plotted below from CFL3D and FUN3D on grid family II. The influence of grid size is also shown.
In general the results from the two codes approach each other as the grid is refined.
Note, however, that it was discovered that CFL3D converges the turbulence (mu_t) along the z=0 wake cut
extremely slowly. Many many thousands of iterations were run, but on the finest two grids the
eddy viscosity in this region was still changing. Full convergence of this particular quantity
in CFL3D on the finest grids had to be abandoned.
TAU results are not shown here because the plots become too crowded; however, they are very consistent with
results using FUN3D. The TAU data are provided in a file accessible in a link below the plots.
In the figures below, CFL3D results are shown using 2nd order for turbulence advection.
The main locations where 2nd vs. 1st made a noticeable difference were near the edge of the boundary layer and
in the far wake. A few plots are shown to illustrate this influence
(1st order turb advection results shown in green).
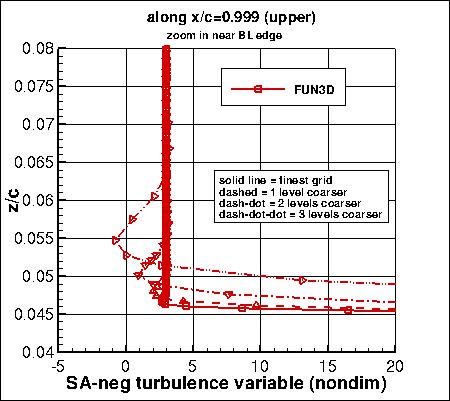
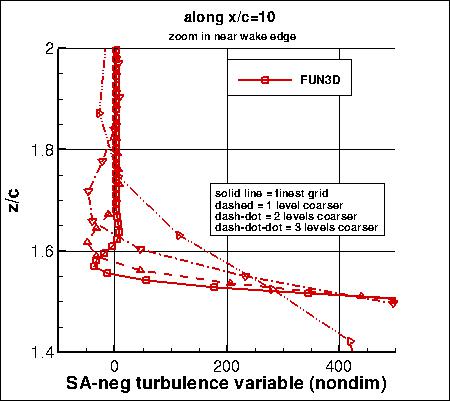
The nondimensional SA-neg turbulence variable (nu_t/nu_inf) is shown below for FUN3D in two different regions.
Results that generated the above plots can be found in the following data files:
FUN3D_Lines_0012_noPV_sorted.tar.gz
(gzipped tar file, 1.5 MB, updated 4/10/2015),
CFL3D_Lines_0012_noPV.tar.gz
(gzipped tar file, 6.6 MB), and
TAU_n0012familyII.1.noPV.2ndorder.extract.dat.gz
(gzipped file, 3.2 MB).
Return to: 2D NACA 0012 Airfoil Validation for Numerical Analysis SA Model Results Intro Page
Return to: 2D NACA 0012 Airfoil Validation for Numerical Analysis Intro Page
Return to: Turbulence Modeling Resource Home Page
Recent significant updates:
10/31/2018 - Added link to NASA-TM-2018-220106
05/18/2018 - Minor correction to cfl3d_cp_sa_nopv_corrected.dat file (fixed values at block interfaces)
02/08/2016 - Added N to files for force and moment grid convergence
07/28/2015 - Added uncertainty estimates for forces and moments
07/21/2015 - Updated all CP and CF data files, to include coarser grid results
04/10/2015 - Updated FUN3D_Lines_0012_noPV_sorted.tar.gz (data are now sorted for easier plotting)
Privacy Act Statement
Accessibility Statement
Responsible NASA Official:
Ethan Vogel
Page Curator:
Clark Pederson
Last Updated: 11/10/2021

